Top Takeaways
— Lyft is on pace to surpass Uber in the United States.
— We estimate Lyft’s U.S. market share of daily active users (DAU) to be 49% while Uber remains the market leader at 51%.
— Given the current trajectory, we forecast Lyft’s U.S. market share to officially surpass that of Uber’s in Q4 of 2020.
The Data Behind Our Statements
TLDR:
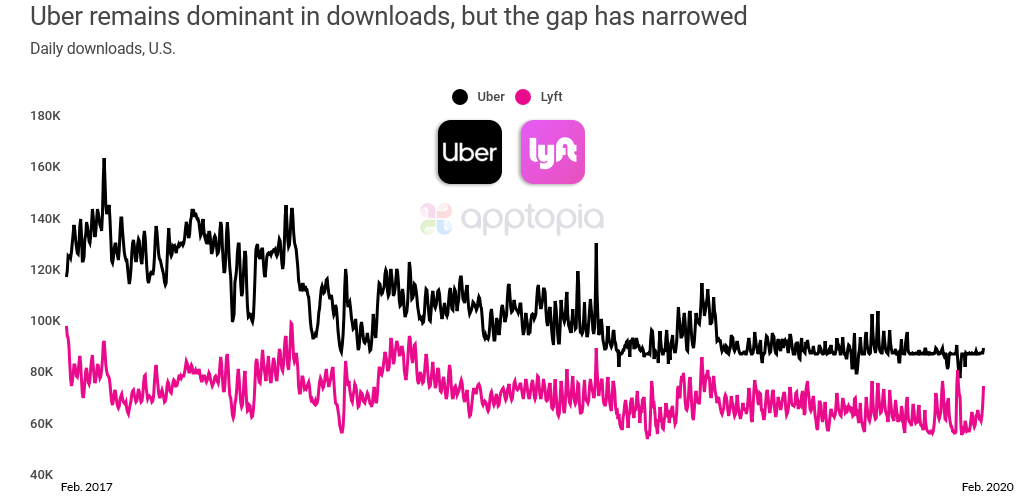
— Both Uber & Lyft are each growing at an impressive clip of at least 2 million new downloads per month in the U.S.
— However, Lyft is growing active users at a notably faster rate over the past 2 years due to a significantly higher retention rate.
— From January 2018 through January 2020, Lyft grew average monthly DAU 75.5% while Uber grew 49.4%.
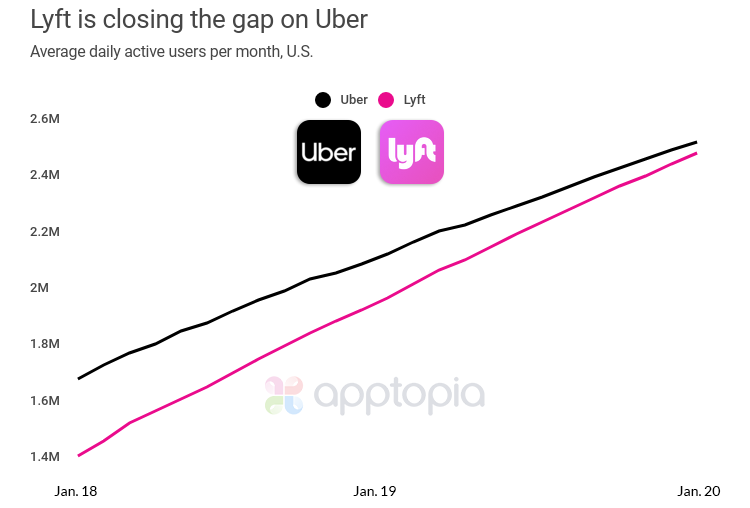
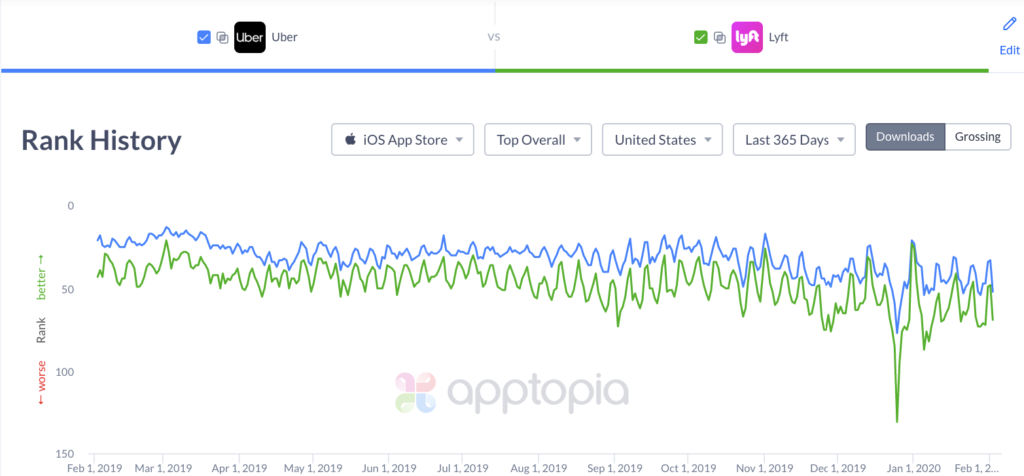
Monthly active users (MAU) and total monthly sessions share a very similar trend to the DAU image above. However, as it pertains to downloads, or net new users, Uber continues to outpace its competition. Lyft has averaged about 27% less monthly downloads than Uber (in the U.S.) over the past six months. Still, as you can see below, the gap is shrinking pretty consistently both in terms of downloads (net new users) and App Store rank (consumer visibility):
Now you are probably thinking, “How could Lyft eventually have more active users than Uber, if Uber is consistently getting more downloads?”. It’s a great question and it’s one we’ve asked ourselves quite a few times prior to publishing this research. Let’s start by talking about advertising & paid user acquisition, as we believe it’s a big part of the story. Thanks to both Uber & Lyft being public companies, we know their factual Sales & Marketing spend:
2018
Uber = $3.2 Billion
Lyft = $567 Million
2019 (through only 3 quarters)
Uber = $3.4 Billion
Lyft = $620 million
Keep in mind Uber operates in 60 different countries while Lyft is only in two. Still, the U.S. is Uber’s largest market. Apptopia estimates 21-25% of Uber’s users are in the United States. Through this, we might infer that 25% or more of their revenue, and therefore 25% or more of their Sales & Marketing budget comes from the U.S. Well, 25% of $3.4B would be $850M, which is still significantly more than that of Lyft. We also know that in mobile specifically, users who are acquired organically tend to have higher retention and engagement vs. users acquired via paid acquisition. Trusted sources even show the following data:
— Organic user retention is over 4% higher than paid acquisition*
— Organic users create over 12% more sessions vs users acquired via paid sources*
We believe this is one key factor impacting Uber’s growth rates, relative to their download rate.
Retention Is Everything.
As we alluded to before, we believe Lyft is beating Uber in the U.S. retention game by a significant margin. Given the data we see today, we believe that if you have decided to keep the Uber / Lyft app after ‘day 30’, you likely will forever. Given that, if you were to compare day 30 retention for Uber vs. Lyft in the U.S., you would see:
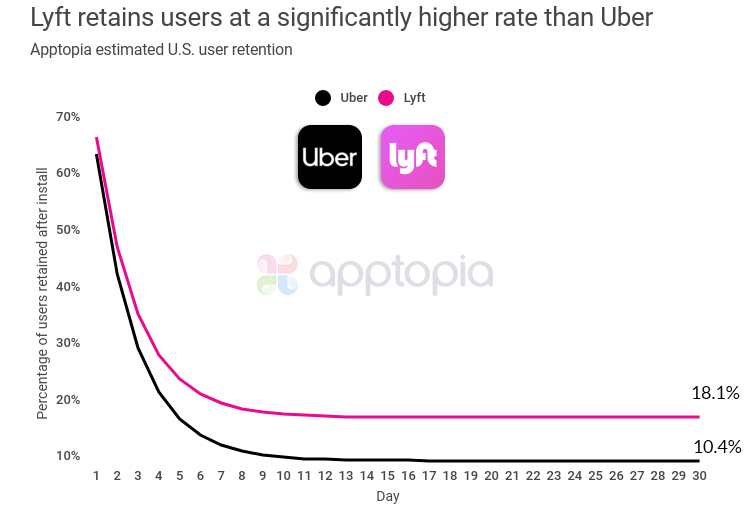
This is one of the single most important metrics in this entire research and so I want to explain in detail how we got here:
- We are assuming that our download estimates are accurate. We feel confident in this because:
- We know from our own statistical validation that this is our most accurate data point.
- Leaders in this industry, as well as many other key mobile markets, have given us consistent feedback on the accuracy of our downloads estimates.
- If there was any bias which existed in our data here, it would be evenly skewed for both Uber & Lyft.
- Our starting point is the publicly reported active usage metrics from both Uber & Lyft’s 10-Qs. Using our downloads metric as the total lifetime potential users, we sought to validate our retention curve for both of these apps. We applied several retention curves, including our own, to our lifetime downloads to see which curve lined up best with the reported numbers from Uber & Lyft. As you will see in the images below, we believe our estimated retention curves for Uber & Lyft are highly accurate.
- Uber reports “MPAC” = Monthly Platform Active Consumers (Uber + Uber Eats). We are making two data driven assumptions here:
- This country breakdown is based heavily on country by country app store rank data over time (which is factual metadata provided by Apple and Google). As such, we have found our geographic breakdowns to be reliable.
- We know that all Uber users are not also users of Uber Eats. However, we believe that there is not a meaningful number of Uber Eats users who are not also users of Uber. This means that the number of MPACs Uber reports is a reasonable / conservatively high estimate for the number of ride hailing active users Uber has worldwide.
- Uber’s reported MPAC number is global, so we are assuming that our country by country breakdown percentages for Uber are accurate. Our data states that the U.S. represents between 21 – 25% of Ubers worldwide user base
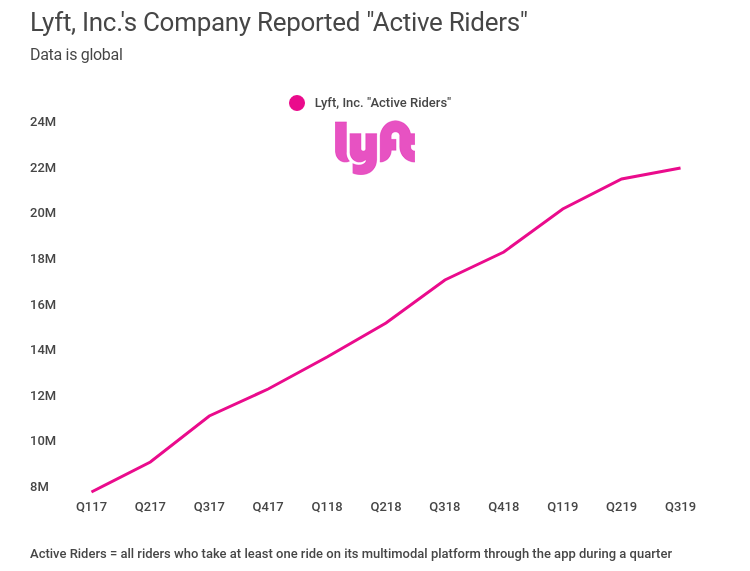
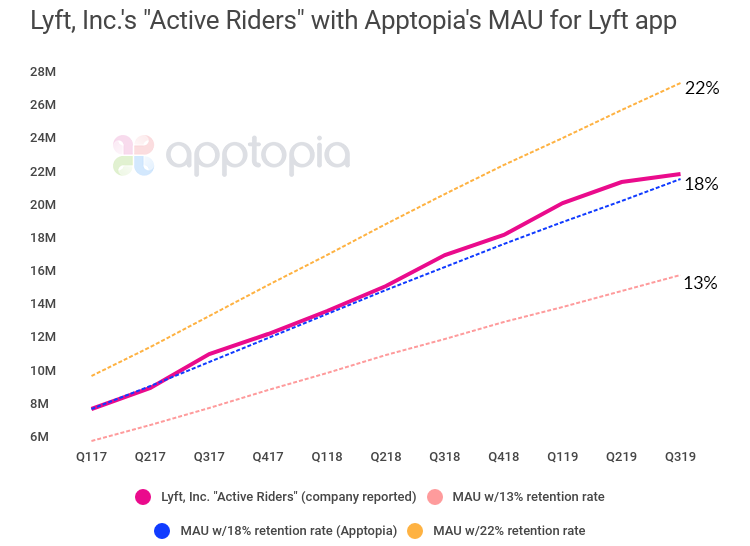
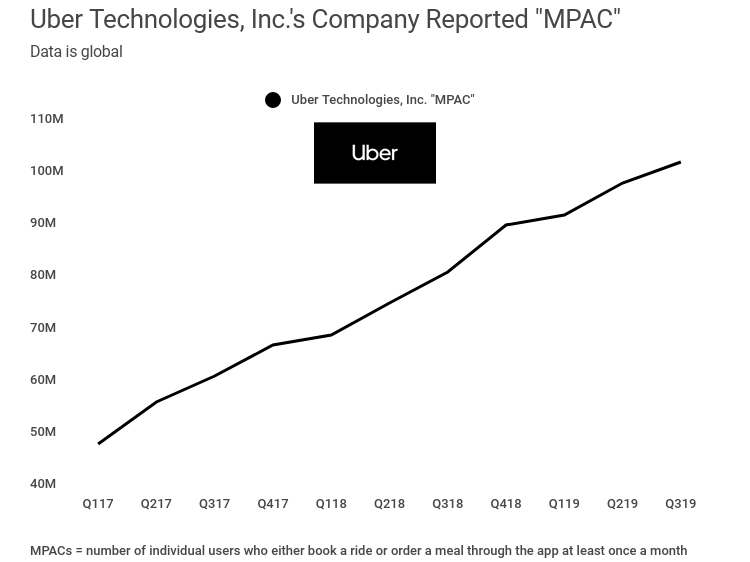
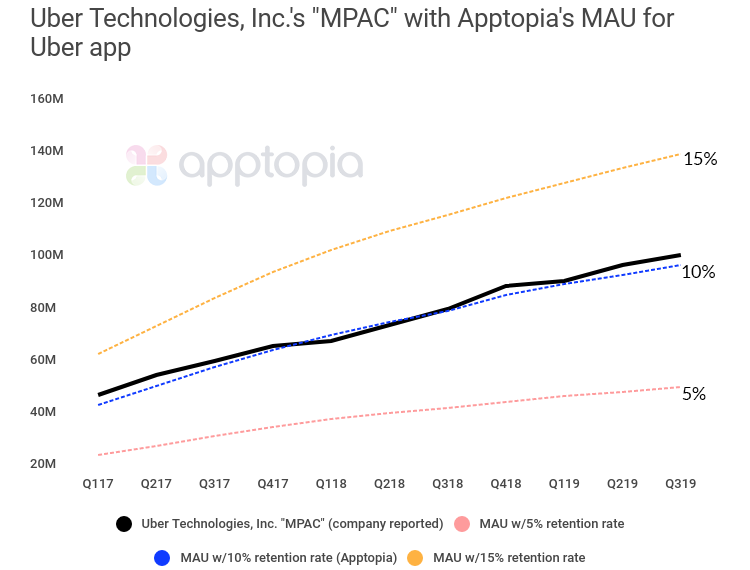
As you can see above, the Day 30 retention rates of Uber (~10%) and Lyft (~18%) are by far the closest fitting curves to Uber & Lyft’s publicly reported metrics.
Let me be clear that we do not claim to speak about revenue, costs, stock price, etc. These things are not our expertise. Mobile app data and the mobile app economy, however, are very much our expertise. And it seems pretty clear that in the U.S., Lyft is neck and neck with Uber’s ride hailing business. Yes, we are aware that in May 2018 Lyft itself said it believes it has 35% of the U.S. market share between itself and Uber. It is reasonable to believe their share of the market has increased in the 20 months since then. In fact, we forecast that Lyft should surpass Uber’s DAU in the U.S. in Q4 2020.
If we had to speculate on what the cause of this is (and we can not stress enough, this is now the opinion portion of this otherwise data-driven piece), here are some of our thoughts:
- Uber is using advertising & paid sources to acquire a meaningful percentage of their new users, and these users are of lower quality than Lyft’s organic user growth.
- Uber’s focus on international growth has caused them to slightly take their eye off of the U.S., where Lyft has continued to focus ~100% of their effort / attention.
- Lyft’s IPO (ahead of Uber’s) raised their brand / consumer awareness a meaningful amount in the U.S.
- Lyft’s investment into business development and key partnerships with companies like Delta, Chase, DoorDash, Hilton, etc. have been yielding strong loyal users.
- Uber has figured out that the ride hailing market in general is a loss leader, and now that they have a good infrastructure, they are now focusing the majority of their resources on the more profitable vertical of food delivery.
We plan to keep a very close eye on these two as 2020 continues to play out – but for now it seems that Lyft has snuck up faster than many expected. Strap in, it should be a fun year.
*Adjust, 2017 https://www.adjust.com/blog/comparing-organic-to-paid-how-acquisition-channels-performed-in-2017/Subscribe to our weekly newsletter to get data like this sent straight to your inbox.
