When launching a new app, the number one priority is usually acquiring users. How we can drive downloads to get users and then monetize them? While it’s a huge accomplishment to build a respectable user base, it is another thing to keep them.
This is where retention comes into play. We’ve compiled retention data for 16 popular mobile games to shed some insight into both the metric itself and these massively popular games. Before we get into the data, we need to know how to read retention.
How do I read retention data?
The day someone downloads your app is known as Day Zero. We assume on download day that the user also opens the app. Retention on Day Zero is always 100%. But do they open the app the next day? This is Day1. What about the day after that? How about a week later? Two weeks later? 30 days? This is exactly what Apptopia’s retention percentage tells us. Keep in mind that if I download Battle Bay on Monday and you download it on Wednesday, my Day1 will be Tuesday whereas yours will be Thursday.
For example, when looking at Day14 retention data for a specific month, it is not showing data for everyone who downloaded on the first of that month. It is showing data for everyone who had their own unique Day14 within that month. They may have downloaded the app the month before but their Day14 fell within the month you’re looking at.
At Apptopia, we can look at retention data for individual apps, groupings of apps and full categories. Retention rates are split out by app store, country and month. The below information is to help you benchmark against the best.
Top store gaming subcategories by day 14 retention
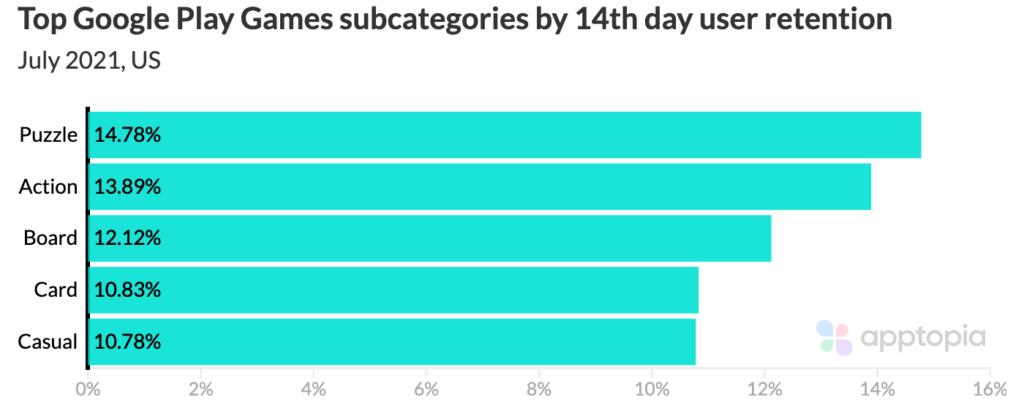
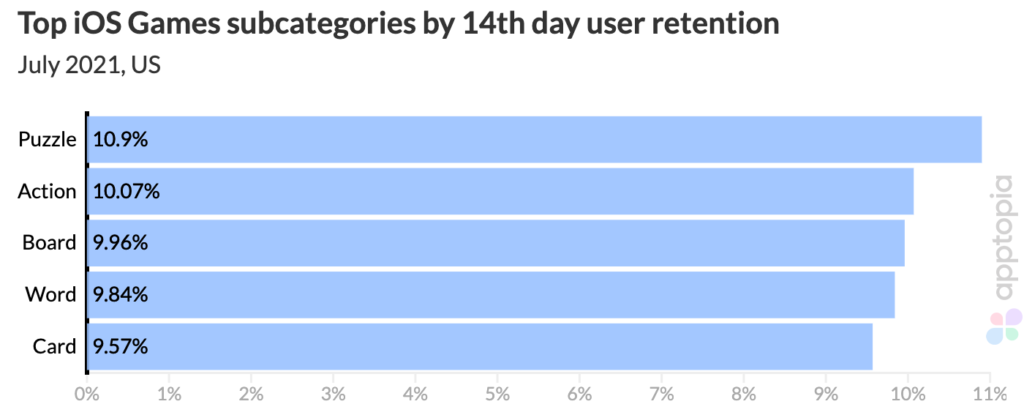
We pulled the top five gaming subcategories per store by average 14th day retention for all games within those subcategories. Comparing the Google Play store and the iOS App Store, the top categories are almost identical. It appears to be that Puzzle and Action games retain users at the highest rates.
Retention rates for most highest grossing and most downloaded Google Play games
We took the 10 highest grossing games and the 10 most downloaded games in the Google Play store for the month of July 2021 and pulled their day 14 retention rates. All data is US only. The apps in the two charts below are in order of their grossing totals and download totals for the month and not by rate of retention.
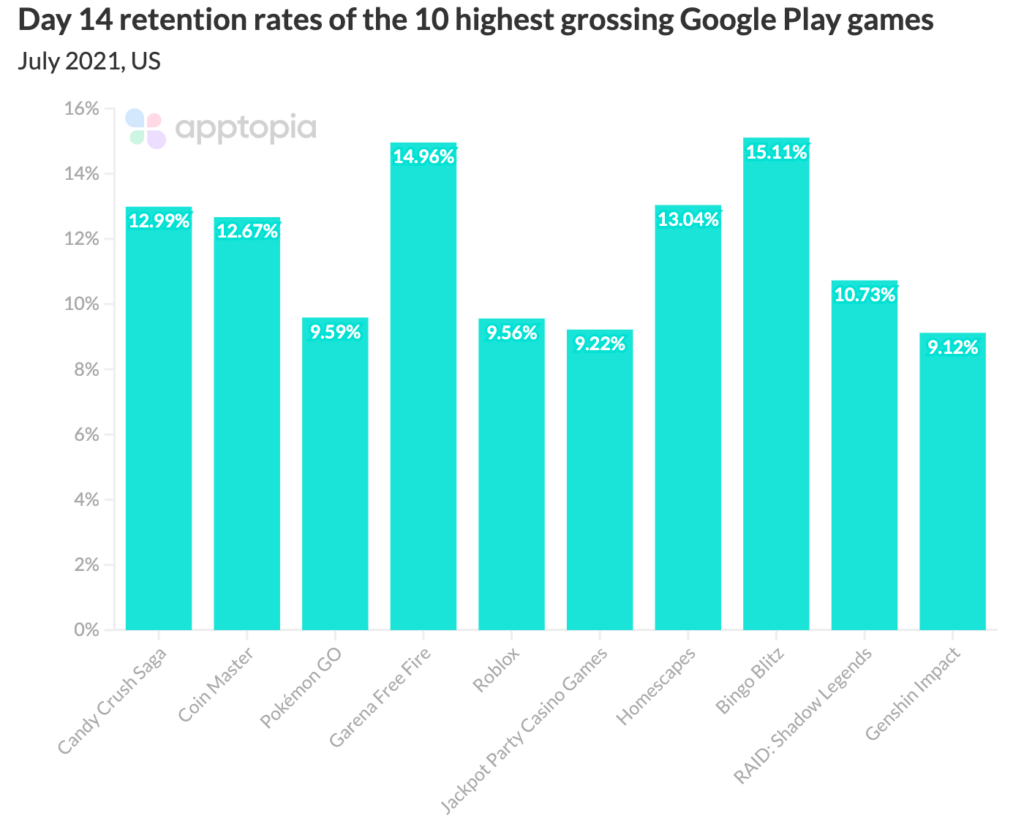
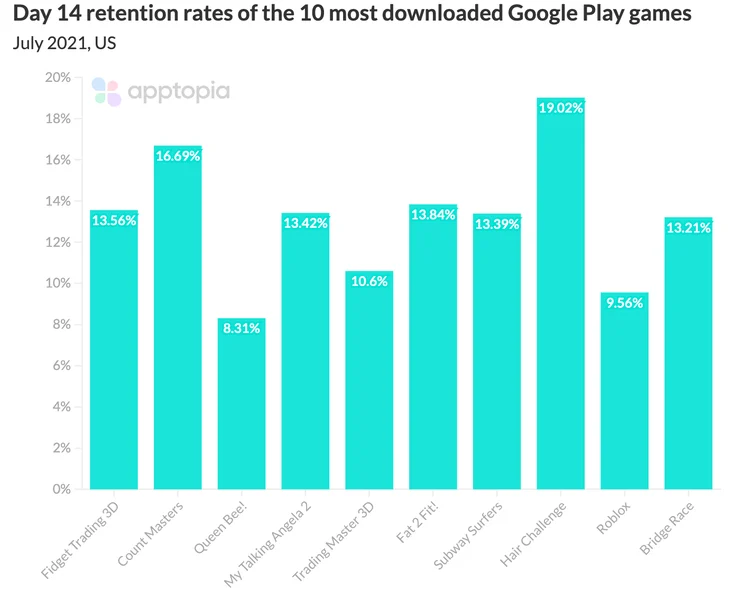
On average, retention rates for the most downloaded Google Play games are higher than those of the highest grossing Google Play games. You would think the opposite would the case. Typically money is seen as a commitment. But players of Google Play games are less likely to spend money than those on iOS. Players here value games where they can still have fun over a long period of time without having to spend money.
Retention rates for most highest grossing and most downloaded iOS games
We took the 10 highest grossing games and the 10 most downloaded games in the iOS App Store for the month of July 2021 and pulled their day 14 retention rates. All data is US only. The apps in the two charts below are in order of their grossing totals and download totals for the month and not by rate of retention.
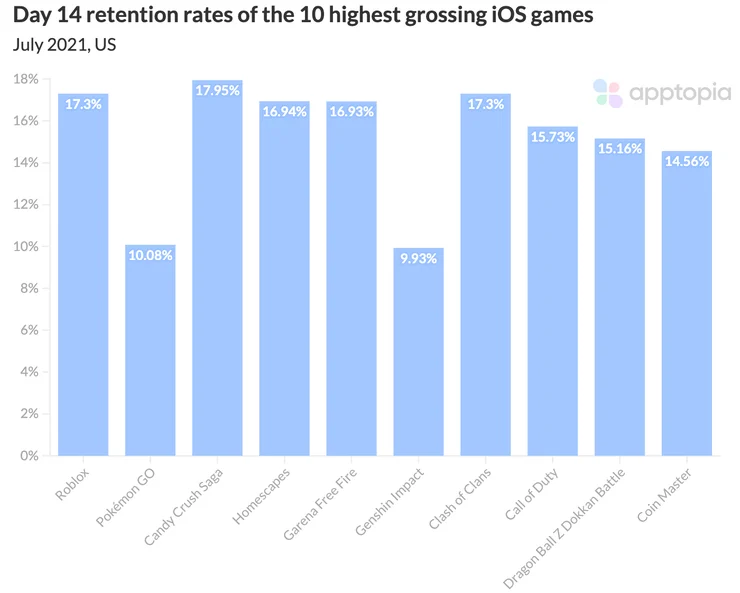
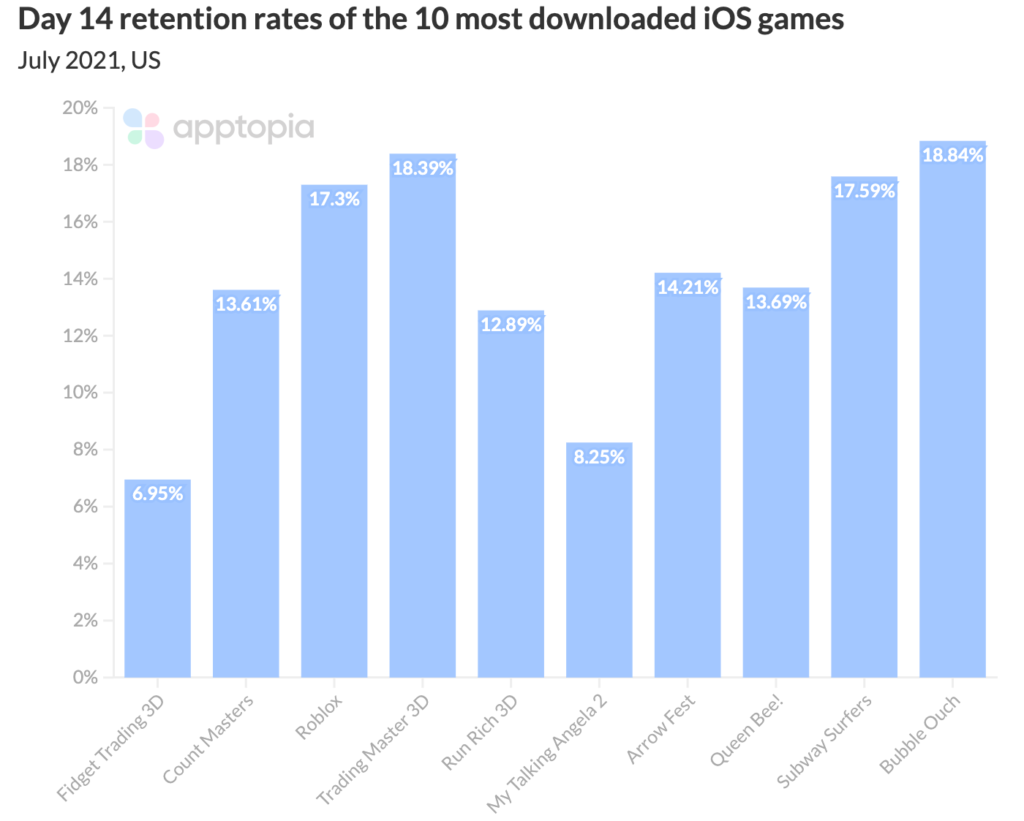
You’ll notice that on average, iOS retention rates are slightly higher than those on Google Play. On iOS specifically we see that the games where users are spending more money retain them slightly better than those that are the most downloaded.
We’ve provided this data to you so you can see how you stack up against the big publishers. Could your retention be better? Is it already better than some of these apps? You should go deeper and benchmark yourself against your direct competitors by clicking the button below.
Benchmark against your direct competitors

