Last October, Financial Times reported time spent on social media was declining globally. The only place where it was continuing to grow was North America. While this was survey data, we wanted to check in on the United States specifically and see if our US consumer device panel is still showing growth here.
The answer is largely yes. Q2 2026 saw average daily time spent on social media apps increase 5.5%. I say largely because it hit a new high in March of 2.91 hours per day but then fell for two months. It rose again for the past two months, but remains under the high water mark of March. Our study period is from January 2023 through July 2026.
The top 5 “OG” social media apps are a stabilizing force, representing anywhere from 72 – 76 percent of all time spent on social media across our study period. These are Facebook, Instagram, TikTok, Snapchat and X. While these apps can and do foster social networking, they are increasingly showing content from people/accounts the user does not know, and increasingly being used as a means of video entertainment.
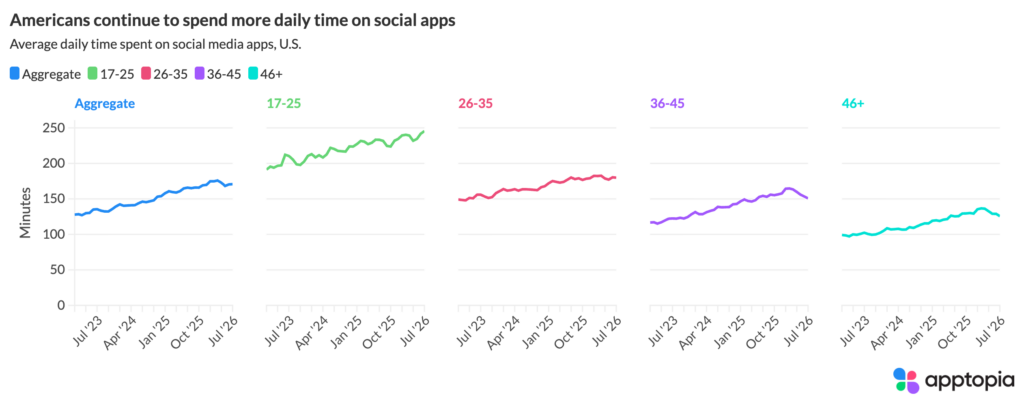
Young adults, those aged 17-25, are spending the most time on social media apps while users aged 46+ are spending the least time. Young adults’ daily time spent on social media apps chart significantly above the rest of the age bands, averaging 39% more than the aggregate this calendar year. Those aged 46+ averaged -24% less than the aggregate over this calendar year..
Looking at intraperiod growth since January 2025, the 46+ cohort has had the highest monthly growth rate since May 2025, except for July, when it dropped below Young Adults and the aggregate. Daily time spent across the top 5 social apps for people aged 36+ has fallen pretty sharply since March while Young Adults’ daily time spent on these apps has ramped up.
What really stood out to me was that even though Americans are spending more time on social media, its share of total phone time is shrinking. This is because time spent on mobile phones is growing faster than time spent on social media.
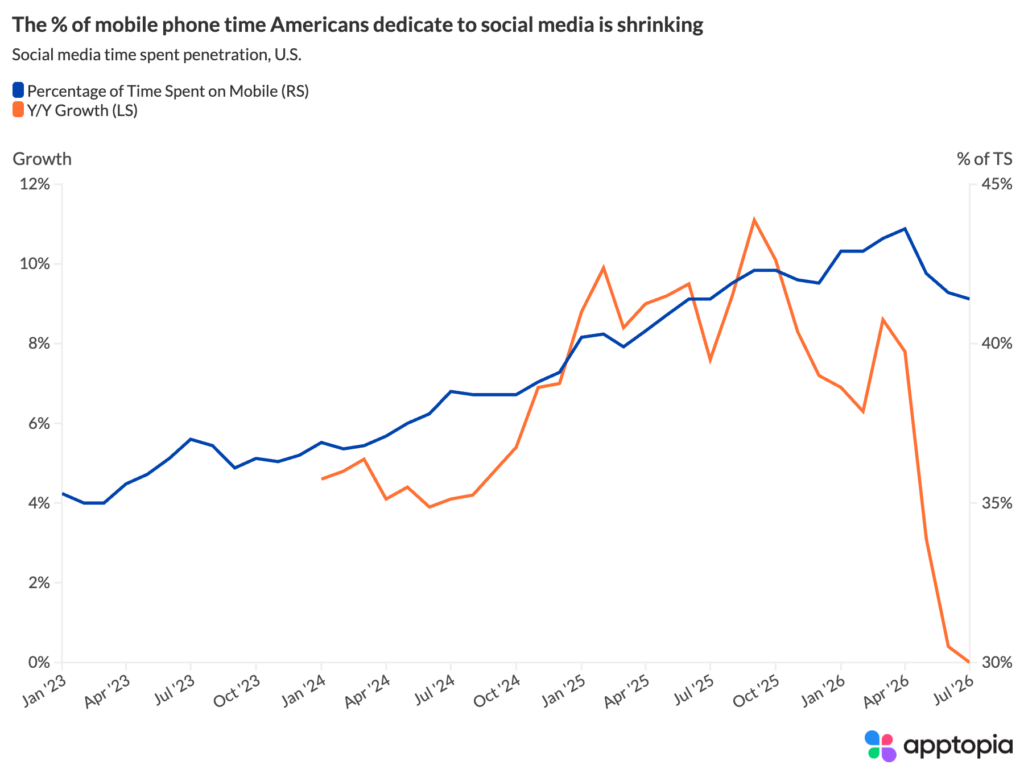
In April, social media apps made up 43.6% of the time spent on our mobile phones but that percentage has for three consecutive months, to 41.4% in July. This 2.13 percentage point drop is the largest negative 3-month change found within our study period. The second largest was a 1.70 point drop earlier this year, from March to June. Notice it encompasses much of the other time period. Year-over-year growth of social media time spent penetration has largely been falling since October 2025.
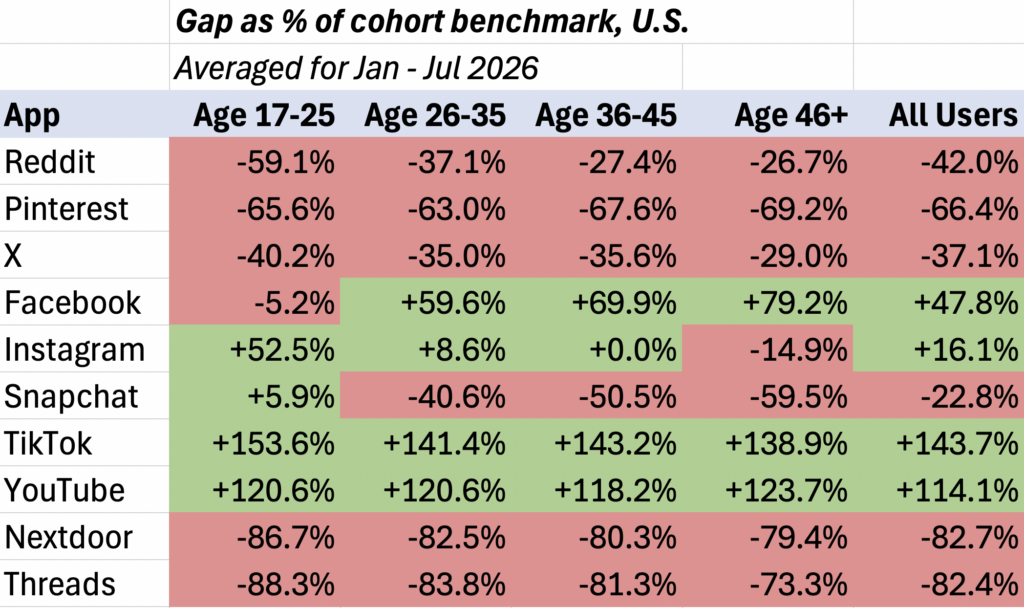
Going back to the Average Time Spent per DAU metric, researchers of the sector are often interested in which apps are above/below the baseline. Unfortunately for my content’s sake, the data is not surprising. TikTok, YouTube, Facebook, and Instagram all sit above the baseline while Reddit, Pinterest, X, Snapchat, Threads, and Nexdoor sit below it. This is the case for the 2026 calendar year across almost all of our standard age bands.
Daily time spent on social media apps is still going strong in the United States, but the percentage of mobile phone time Americans are dedicating to social media is decreasing. Why? Because we’re using more apps and doing more things on our phones these days. Young adults are still the bread and butter for social apps, spending 39% more time than the aggregate across social media apps every day.