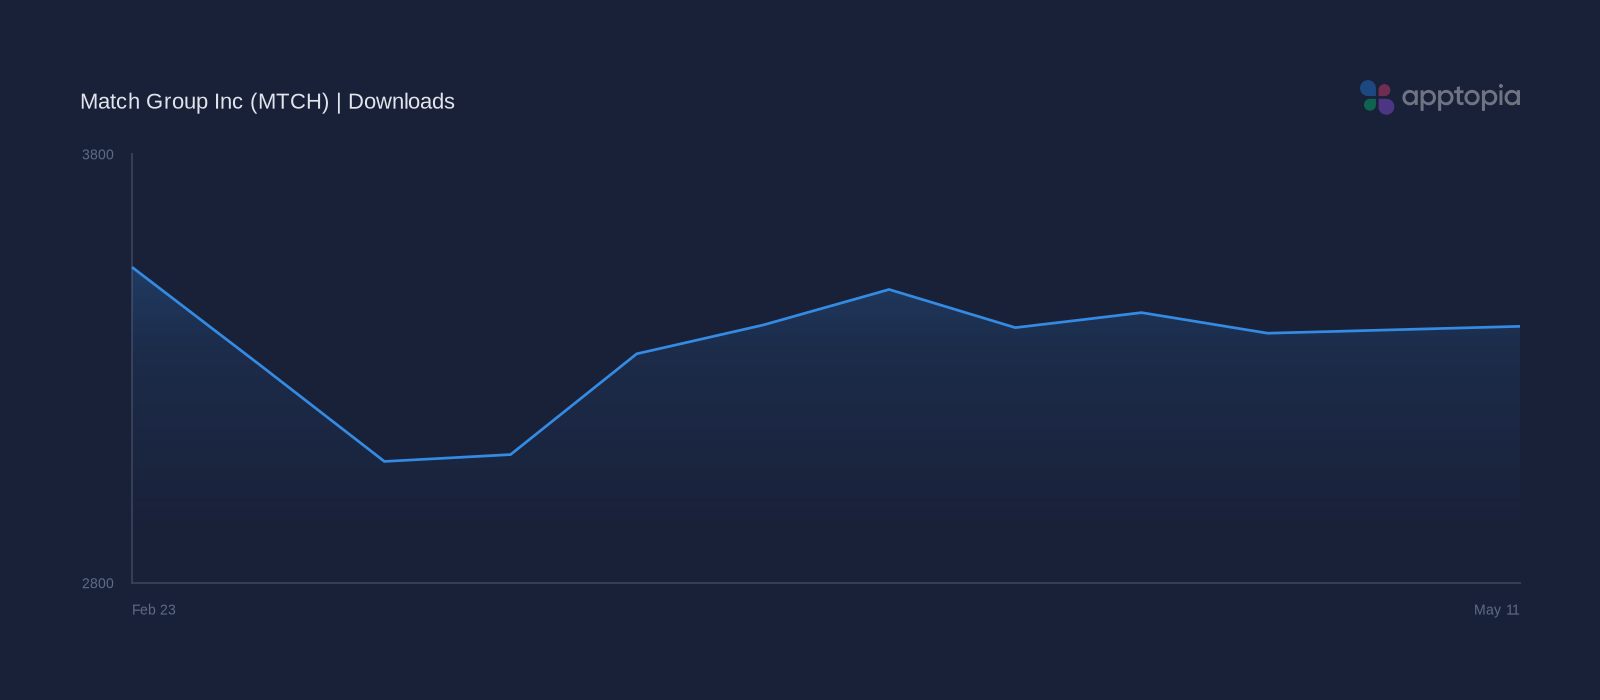
Downloads Held Near 3.4M, Up 4.6% YoY
For the week of May 11, downloads reached an estimated 3.4M, rising 0.2% WoW, declining 25.4% QoQ, and rising 4.6% YoY.
For investors, that mix may point to steadier near-term demand on a weekly basis, while engagement trends help show whether softer quarterly acquisition is pressuring usage.
Estimated weekly sessions reached 3.3B for the Week of May 11, rising 0.1% WoW, declining 0.4% QoQ, and rising 8.1% YoY.
For investors, this divergence may signal a softer top-of-funnel pipeline even as stable session activity supports near-term revenue resilience.
Engagement growth remained positive amid mixed intensity trends
In Q1 2026, Match Group’s estimated DAU reached 62.6M, up 1.4% QoQ and 8.0% YoY, while estimated MAU climbed to 280.3M, up 0.1% QoQ, a pattern that, for investors, suggests audience expansion remained intact even as engagement intensity diverged across apps.
The platform mix indicates stable aggregate reach, with Hinge gaining scale and usage intensity while Plenty of Fish and Tinder showed weaker session frequency, suggesting expansion quality may depend increasingly on Hinge to offset softer engagement in more mature apps.
Retention Quality Appears Relatively Healthy
Plenty of Fish Dating App’s user churn held at an estimated 35.8% in Q1 2026, with YoY change of -10.6%; this low attrition profile may indicate relatively healthy retention quality under the sub-40% threshold.
This churn level may indicate relatively steadier recurring revenue durability than higher-churn peers and could support more efficient CAC payback if acquisition trends remain disciplined. Tinder estimated churn was 33.3%, while Hinge estimated churn reached an estimated 41.0%. Tinder shows the strongest retention profile, Plenty of Fish is intermediate, and Hinge has the highest churn risk.
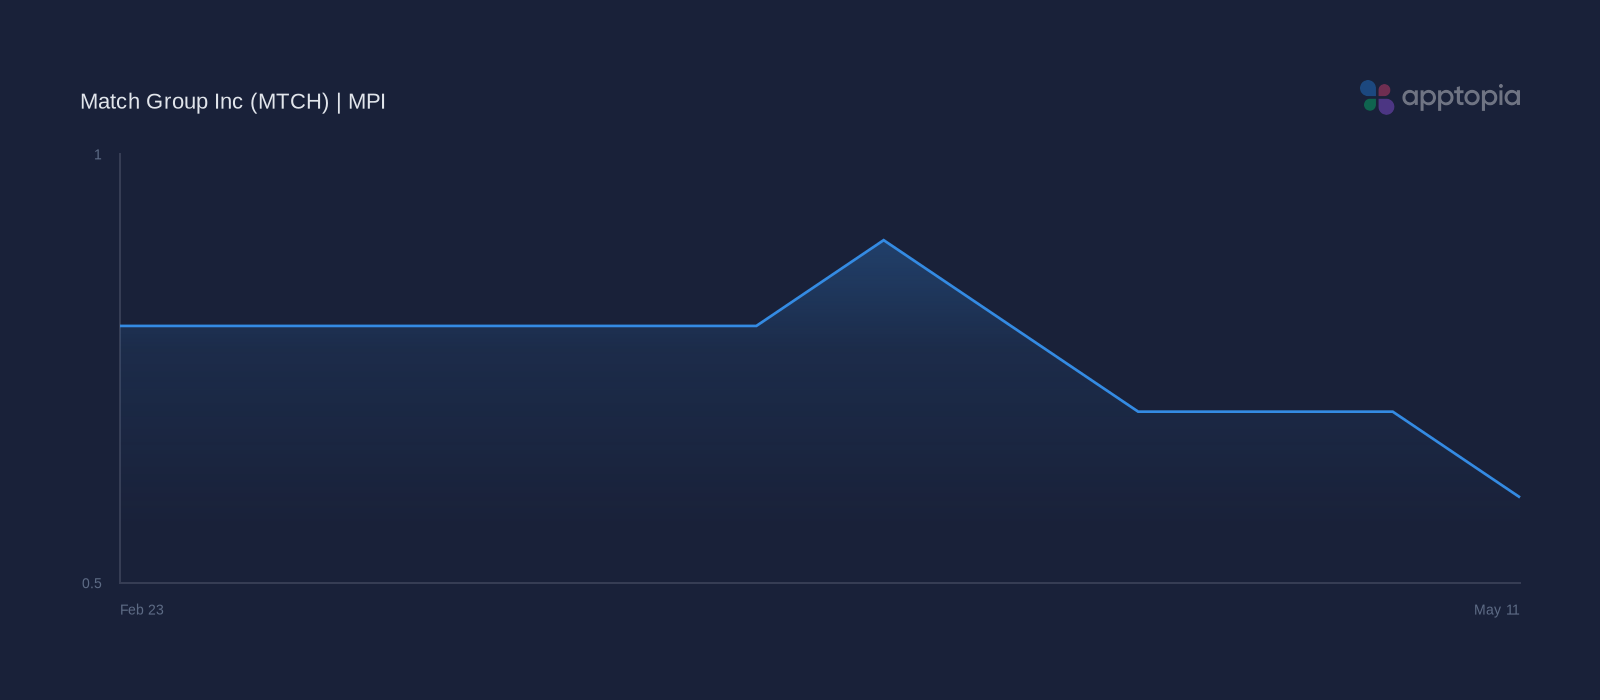
MPI Retreated -21.9% WoW, -6.9% YoY
One of the key metrics investors track for Match Group Inc (MTCH) is its Tinder Payers KPI, which can inform investor interpretation of business performance across reporting periods, and Apptopia’s Mobile Performance Index (MPI) was selected for analysis given its relationship to that monetization indicator.
These correlations suggest that investors should monitor Apptopia’s data to understand how Match Group Inc is trending for its Tinder Payers KPI.
Match Group Inc’s MPI showed declining performance, with -21.9% WoW in the Week of May 11 and -6.9% YoY, while the -2.4% QoQ reading in Q1 2026 suggests Apptopia’s standalone mobile performance signal may indicate weakening engagement momentum across near-term and longer-term timeframes.
Investors should monitor Apptopia’s MPI for MTCH to gauge whether declining momentum continues into Q2 2026.
Mixed Mobile Signals Amid Retention Strength
Match Group’s mobile metrics show a mixed profile heading into Q2 2026, as declining MPI suggests softer momentum despite steadier acquisition and positive audience growth. Retention remains varied across apps, with churn at 35.8% for Plenty of Fish, 33.3% for Tinder, and 41.0% for Hinge.
Apptopia’s MPI for MTCH serves as a mobile performance signal for assessing how this mixed start in Q2 2026 is tracking against steadier session trends and uneven engagement across the app portfolio.
Investors should use Apptopia’s data to track whether declining MPI, softer top-of-funnel expansion, and Hinge’s relative strength continue to define Match Group’s mobile performance.