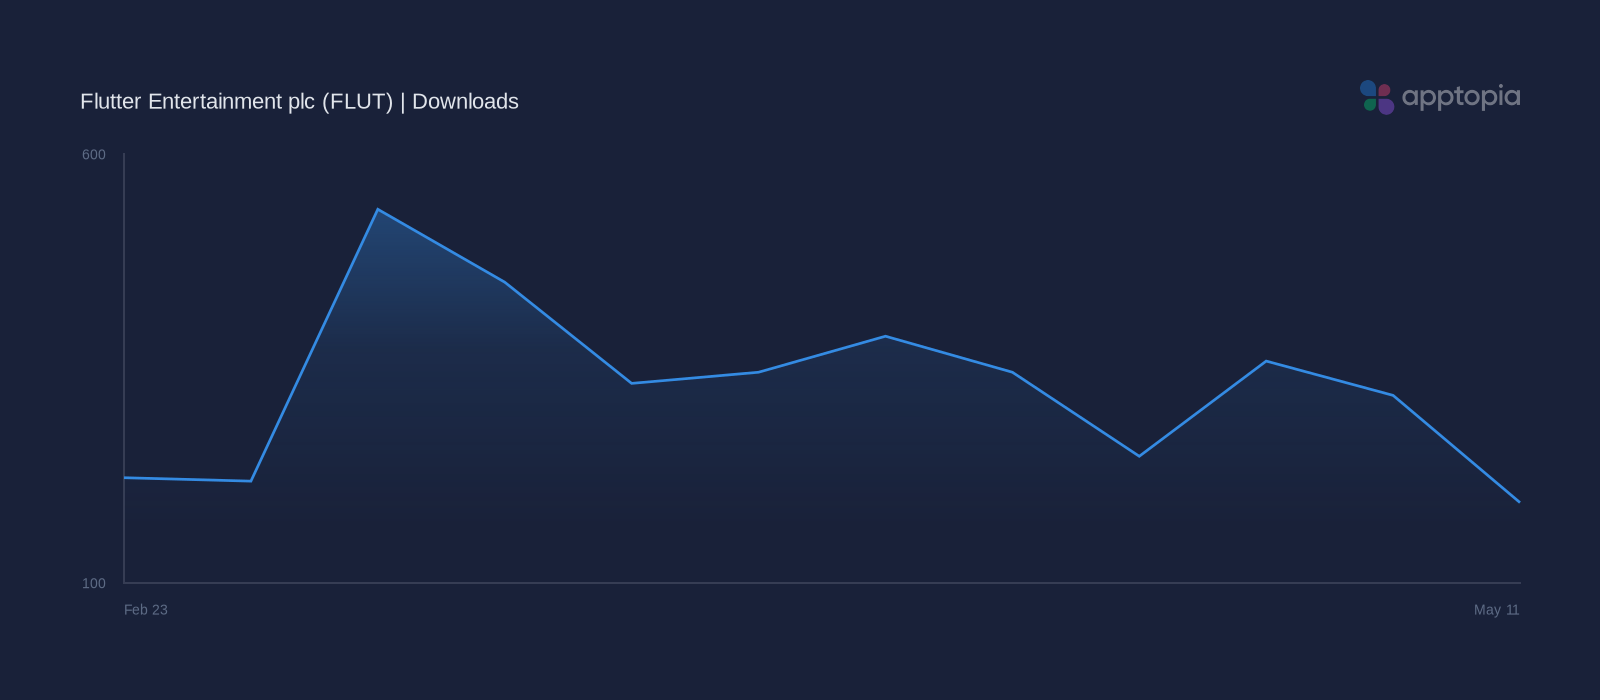
Downloads Retreated to 194.4K (-6.3% YoY)
For the week of May 11, downloads reached an estimated 194.4K, falling -39.1% WoW, -18.1% QoQ, and -6.3% YoY.
That coordinated weakness in acquisition makes engagement trends an important read on whether softer user inflows are extending into platform activity.
Estimated weekly sessions reached 35.2M for the Week of May 11, declining -20.2% WoW, -19.1% QoQ, and -4.8% YoY.
This aligned deterioration suggests weakening acquisition efficiency and user activity, and may signal pressure on engagement and monetization metrics over the next 1-2 quarters if sustained.
Engagement contraction persisted despite firmer core-user intensity
For the week of May 11, Flutter Entertainment plc’s DAU fell to an estimated 727.5K, down -19.9% WoW and -4.5% YoY, while MAU reached an estimated 11.3M, down -5.7% WoW; this divergence from improving Q1 2026 per-DAU intensity suggests the active user base is shrinking faster than engagement among remaining users.
In Q1 2026, shrinking reach alongside firmer sequential daily usage intensity indicates some stabilization in core-user engagement, though the still-negative year-over-year intensity backdrop suggests expansion quality may remain pressured and near-term monetization support from core-user activity could be offset by weaker scale if sustained.
Retention Challenges
FanDuel Sportsbook & Casino’s user churn reached an estimated 43.43% in Q1 2026, up 8.9% QoQ and 7.3% YoY, a moderate attrition level that indicates mixed retention health as trends worsen.
For investors, moderate but rising churn may correlate with less predictable recurring revenue and could pressure CAC efficiency if replacement user acquisition is needed to offset attrition.
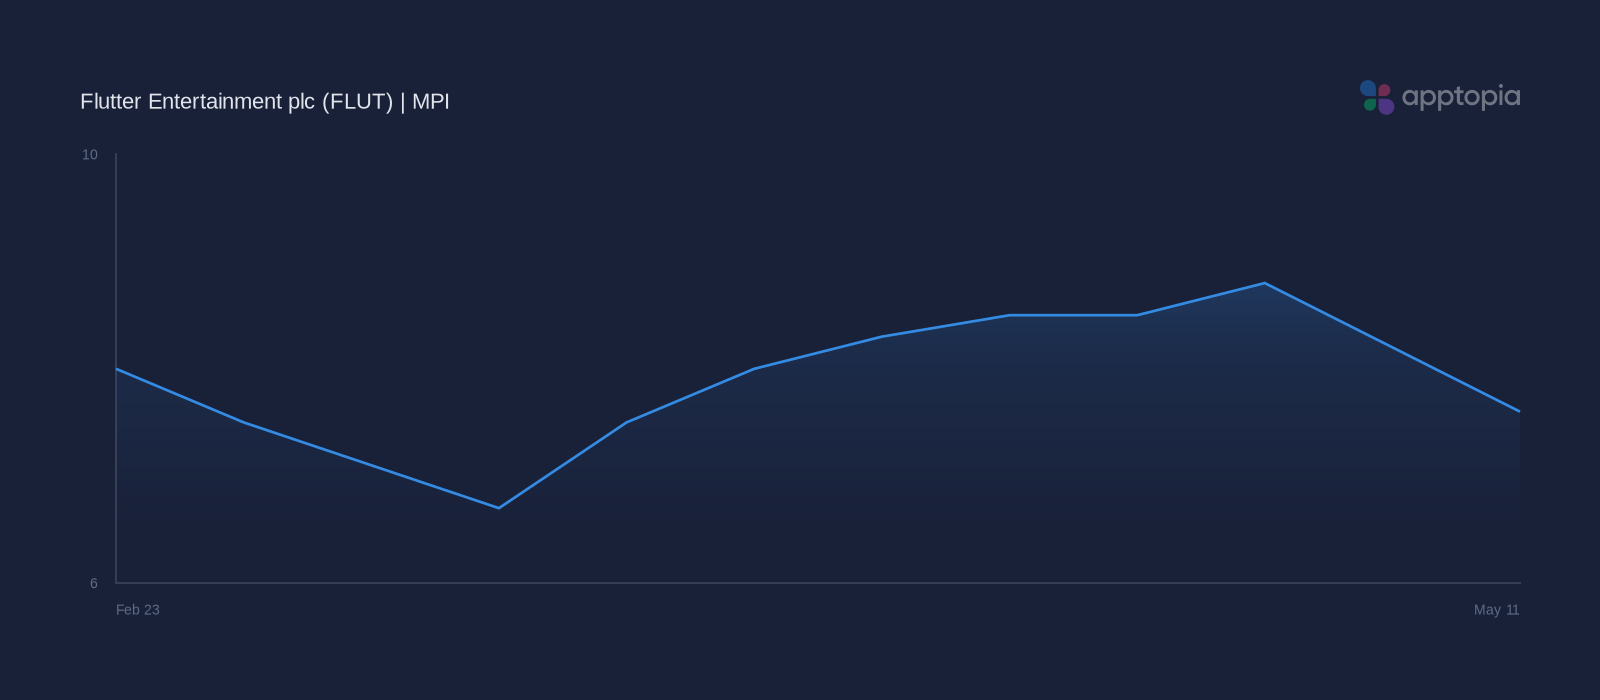
MPI Retreated -7.6% WoW, -0.3% YoY
One of the key metrics investors track for Flutter Entertainment plc (FLUT) is its Average Monthly Players (AMPs) – United States, which may indicate the scale and engagement of its active U.S. paying customer base.
Among the hundreds of data points Apptopia tracks, Apptopia’s Mobile Performance Index (MPI) was selected for FLUT because it suggests a relationship with Average Monthly Players (AMPs) – United States.
These correlations suggest that investors should monitor Apptopia’s data to understand how Flutter Entertainment plc is trending for its Average Monthly Players (AMPs) – United States KPI.
Flutter Entertainment plc’s Mobile Performance Index showed declining performance in Q1 2026, with -7.6% WoW in the Week of May 11 and -0.3% YoY, while the -13.4% QoQ drop suggests weakening mobile engagement momentum after a higher Q4 2025 baseline.
For investors, declining Apptopia’s MPI typically correlates with weaker near-term stock sentiment around earnings, though the modest YoY deterioration may limit downside if subsequent mobile trends improve.
Investors should monitor Apptopia’s MPI for FLUT to gauge whether declining momentum continues into Q2 2026.
Mixed Mobile Trends With Clear Near-Term Headwinds
Flutter Entertainment plc’s mobile metrics show a mixed but weakening profile heading into Q2 2026, as declining MPI and coordinated softness in acquisition suggest near-term pressure even as stronger core-user engagement intensity points to some stabilization.
Apptopia’s data provides a useful lens for monitoring how shrinking user breadth, moderate churn at approximately 43.4%, and steadier activity among remaining users are shaping Flutter Entertainment plc’s near-term trajectory into earnings.
Investors should use Apptopia’s metrics to track whether acquisition trends, engagement breadth, and retention quality become more aligned heading into the next earnings window.