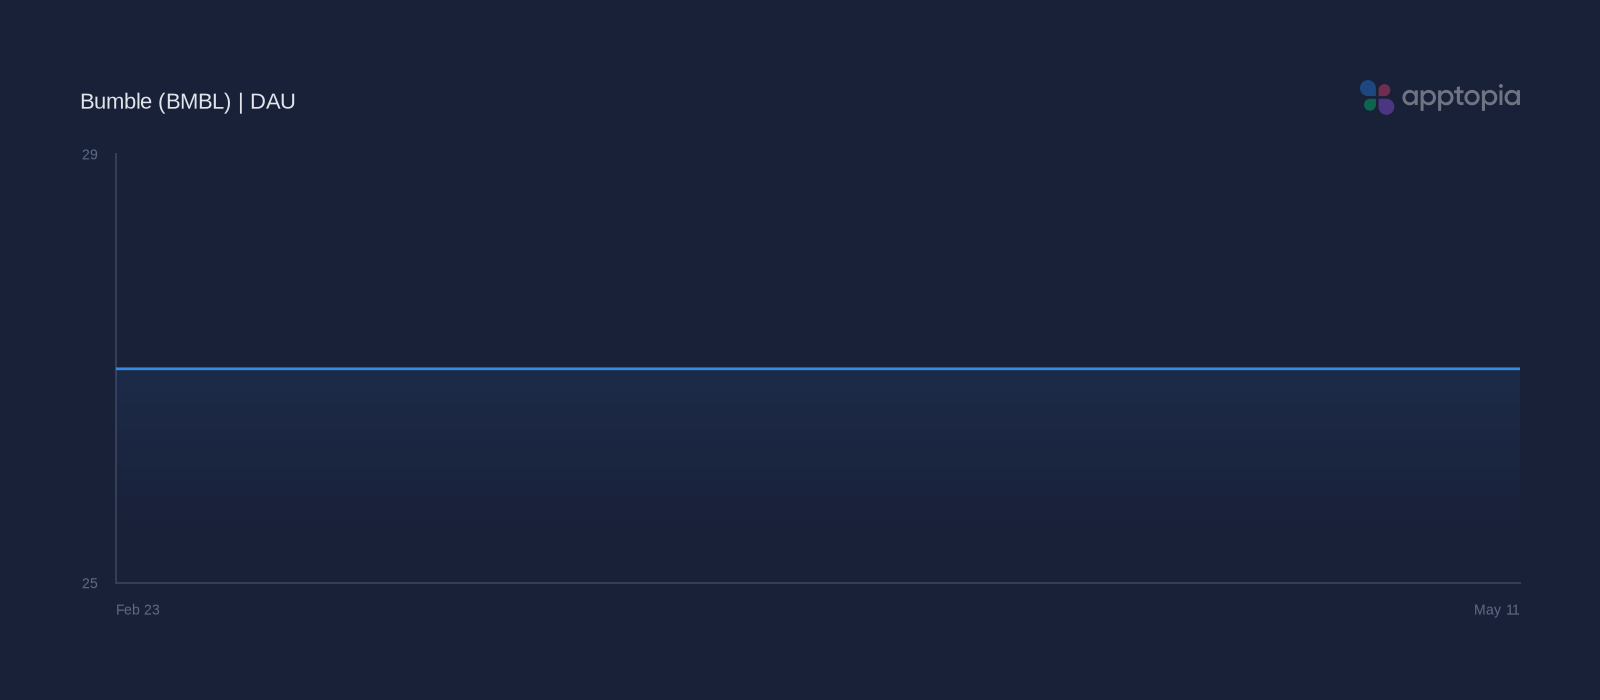
Engagement Trends
For the week of May 11, Bumble’s DAU reached an estimated 26.9M, up 0.4% WoW and 2.8% YoY, while MAU was an estimated 131.1M and down 0.1% WoW, a pattern that suggests user reach remained stable as engagement intensity shifted.
In Q1 2026, Bumble Dating App: Meet & Date saw declining sessions per DAU alongside higher time spent per DAU, while Badoo Dating App: Meet & Date’s sessions per DAU and time spent per DAU followed their own app-level pattern, which indicates longer but fewer sessions and may signal mixed engagement quality as stable scale and rising time spent typically support monetization more than user growth alone.
Downloads Retreated to 1.4M (-17.7% YoY)
For the week of May 11, downloads reached an estimated 1.4M, declining 0.2% WoW, -23.6% QoQ, and -17.7% YoY.
That pullback points to pressured acquisition, making engagement trends important for judging whether the existing base is absorbing weaker top-of-funnel demand.
Estimated weekly sessions reached 1.3B for the Week of May 11, rising 0.3% WoW, -2.8% QoQ, and 1.7% YoY.
This divergence suggests softer new-user acquisition, while steadier usage may partially cushion near-term revenue pressure if monetization per user holds.
Retention Quality Remains Healthy
Bumble Dating App: Meet & Date’s user churn was an estimated 39.3% in Q1 2026, down 3.5% YoY, while Badoo Dating App: Meet & Date’s user churn was an estimated 33.3% in Q1 2026, down 3.1% YoY, which indicates Badoo’s churn was 6.0 percentage points lower than Bumble’s.
This churn level may suggest manageable revenue leakage and steadier monetization versus higher-churn peers, while Badoo’s lower churn than Bumble’s may imply better recurring revenue visibility and more efficient CAC payback if acquisition quality holds.
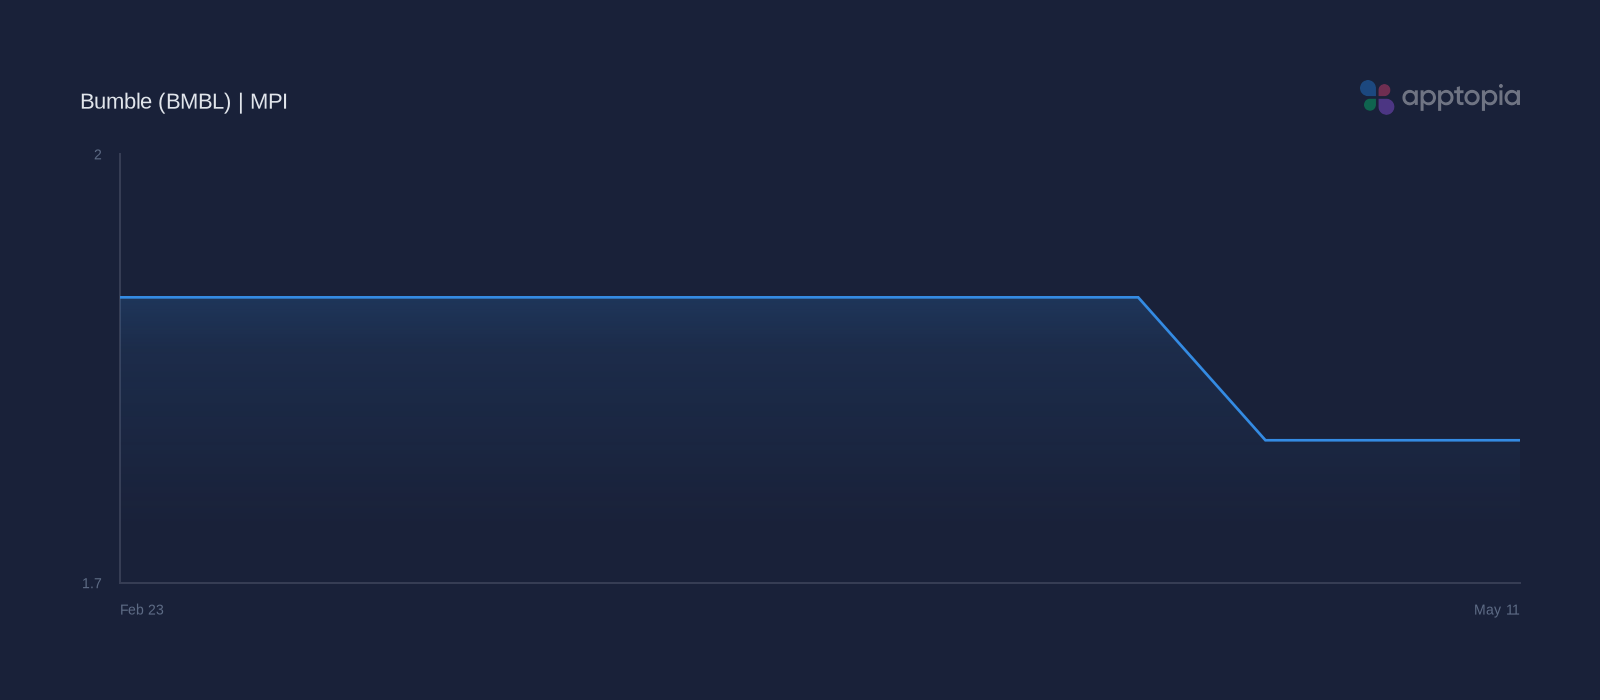
MPI Held Steady at -1.1% QoQ, -8.9% YoY
One of the key metrics investors track for Bumble (BMBL) is its Bumble App Paying Users, which management frames as a core indicator of monetization and platform health; among the hundreds of app metrics Apptopia tracks, Apptopia’s Mobile Performance Index (MPI) was selected for analysis because it may indicate how mobile ecosystem health aligns with that KPI.
These correlations suggest that investors should monitor Apptopia’s data to understand how Bumble is trending for its Bumble App Paying Users KPI.
Bumble’s Mobile Performance Index held relatively stable, down 1.1% QoQ in Q1 2026 and -8.9% YoY, with the narrow multi-quarter range suggesting mobile engagement momentum may be contained despite modest underlying weakness.
Investors should monitor Apptopia’s MPI for BMBL to gauge whether stable momentum continues into Q2 2026.
Mixed Mobile Trends Hold in Place
Bumble’s mobile metrics show a mixed profile heading into Q2 2026, as stable MPI suggests momentum is holding in a contained range while acquisition remains pressured, engagement is uneven, and retention appears relatively healthy.
Apptopia’s data provides a useful lens for monitoring how these cross-currents are shaping Bumble’s near-term trajectory into earnings.
Investors should use Apptopia’s MPI and engagement metrics to track whether stable user retention and deeper time spent can outweigh continued download weakness.