
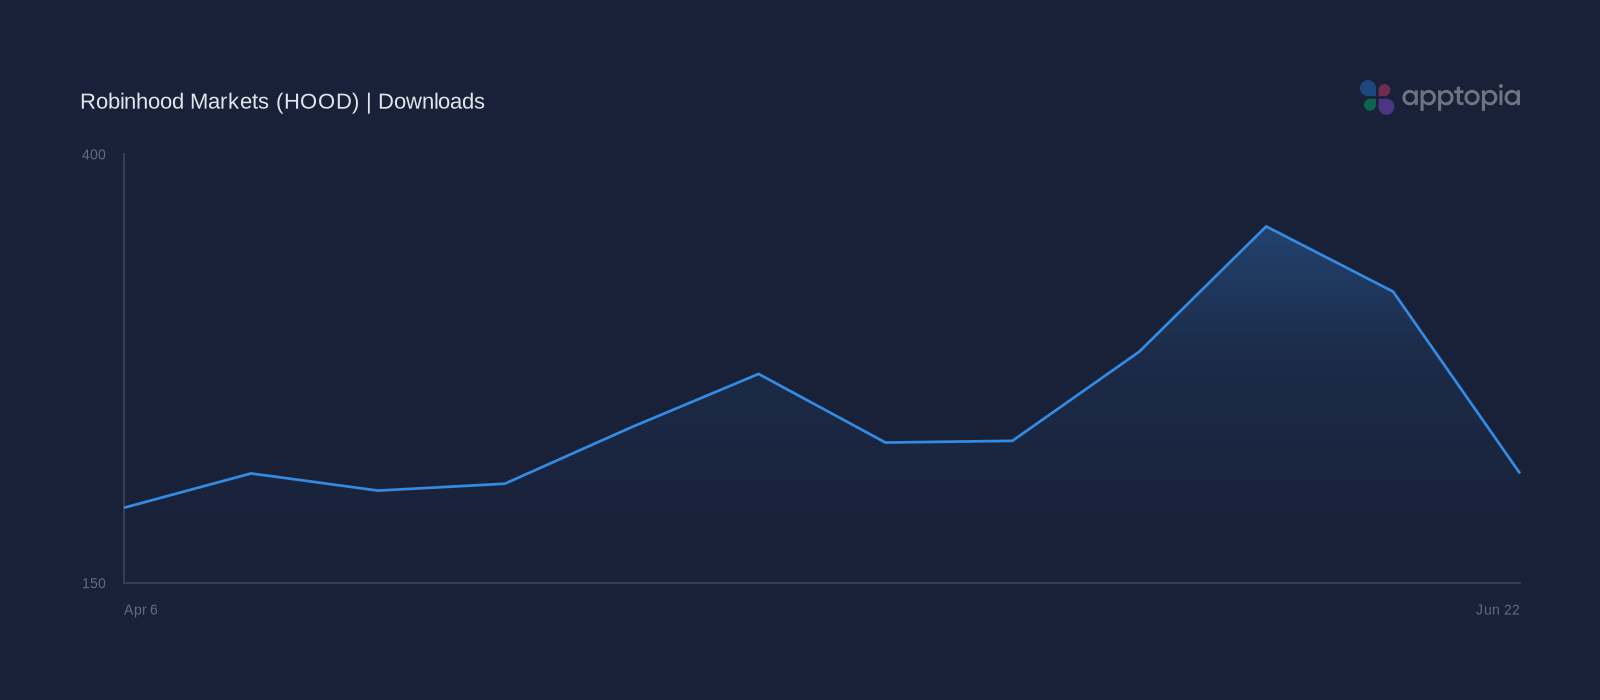
Downloads Retreated to 214.3K (-33% WoW)
For the Week of June 22, downloads reached an estimated 214.3K, falling -33% WoW, rising 4.2% QoQ, and growing 2.2% YoY.
The weekly pullback contrasts with Robinhood Markets’ improving Q1 2026 acquisition base, making sessions a useful check on growth quality.
Estimated weekly sessions reached 99.3M for Week of June 22, falling -24.8% WoW, rising 2.4% QoQ, and declining -1.6% YoY.
For investors, the sessions divergence may temper revenue read-through despite modest download growth.
DAU slips while MAU expands
Robinhood Markets’ DAU reached an estimated 2.7M for the week of June 22, down 23.8% WoW; in Q1 2026, DAU declined 1.8% YoY despite 4.5% QoQ growth, while MAU reached an estimated 33.0M, up 3.5% YoY.
Avg sessions per DAU fell 7.4% YoY as avg time spent per DAU rose 10.5% YoY, which, for investors, suggests fewer, longer engagement occasions with implications for transaction frequency and retention visibility.
User churn at 34.3% signals low churn category
Robinhood: Trade Anything churn stood at an estimated 34.3% in Q1 2026, with YoY growth of 11.3%, placing retention in the low-churn category despite a worsening trajectory.
For investors, low churn typically correlates with steadier recurring engagement economics, while deterioration may pressure lifetime value trends and CAC payback efficiency if it persists.
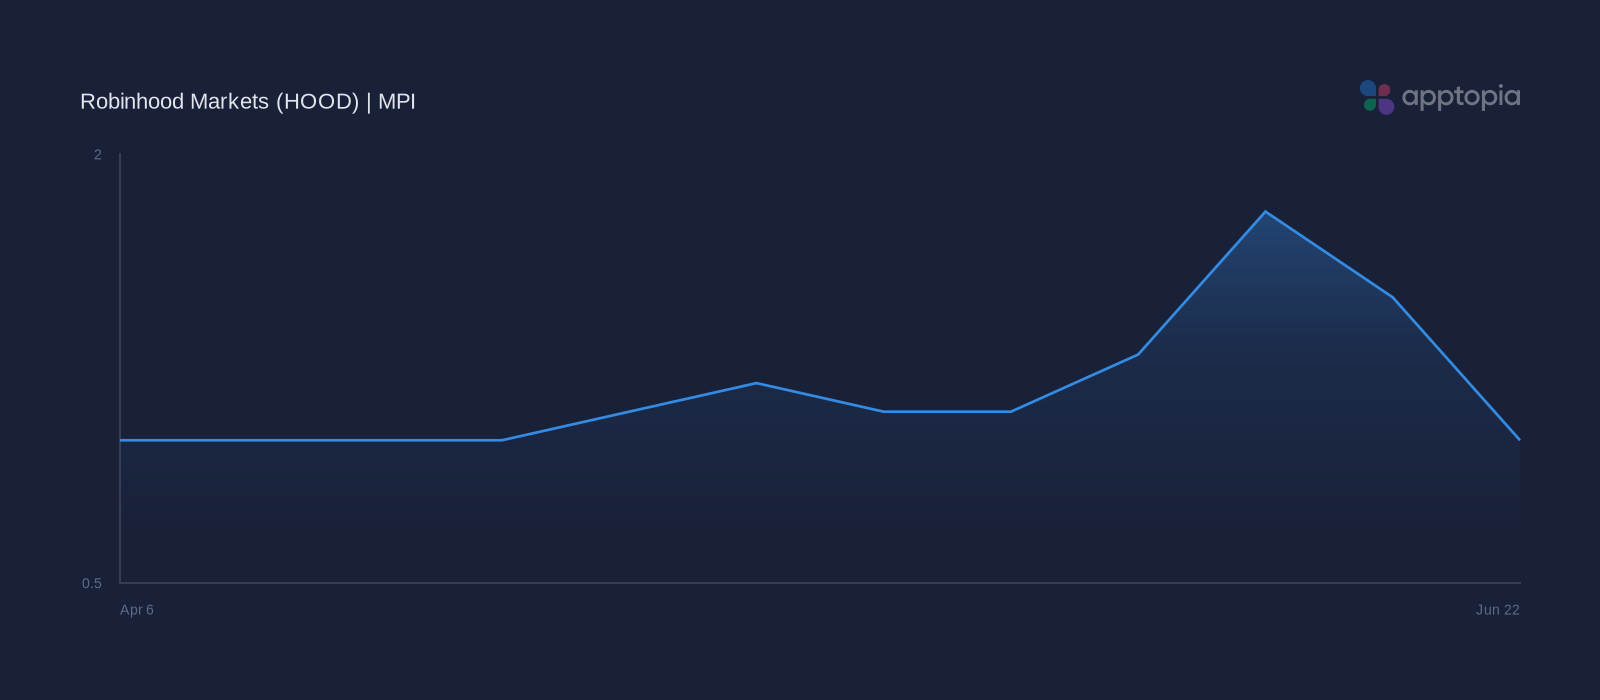
MPI held steady: 1.6% QoQ despite -30.2% WoW
Robinhood Markets (HOOD) identifies Monthly Active Users (MAU) in SEC filings as a key operating metric for customer scale, engagement, ecosystem health, and transaction-based revenue.
These correlations suggest that Apptopia’s data, including Apptopia’s Mobile Performance Index (MPI), offers context for understanding how Robinhood is trending for its Monthly Active Users (MAU) KPI.
Robinhood Markets’ MPI held a stable trajectory in Q1 2026, with 1.6% QoQ growth and -2.1% YoY performance, though the Week of June 22 signal fell -30.2% WoW; as a standalone mobile performance signal, that mix may indicate range-bound momentum rather than acceleration.
Investors should track Apptopia’s MPI for HOOD as a leading indicator of Robinhood Markets’ mobile momentum heading into Q2 2026.
Mixed Mobile Momentum Across Lifecycle Metrics
Apptopia’s modeled signals indicate Robinhood Markets’ stable MPI and mixed lifecycle trends point to Q2 2026 starting with a mixed mobile profile, as acquisition pullback and lower session frequency offset audience expansion, longer time spent, and relatively healthy retention.
Apptopia’s MPI for HOOD provides a useful lens for assessing whether softness for the Week of June 22 may limit otherwise improving quarterly mobile momentum.
Investors should use Apptopia’s MPI, acquisition, engagement, and retention metrics to gauge whether download recovery and steadier session intensity are improving the quality of that growth.