
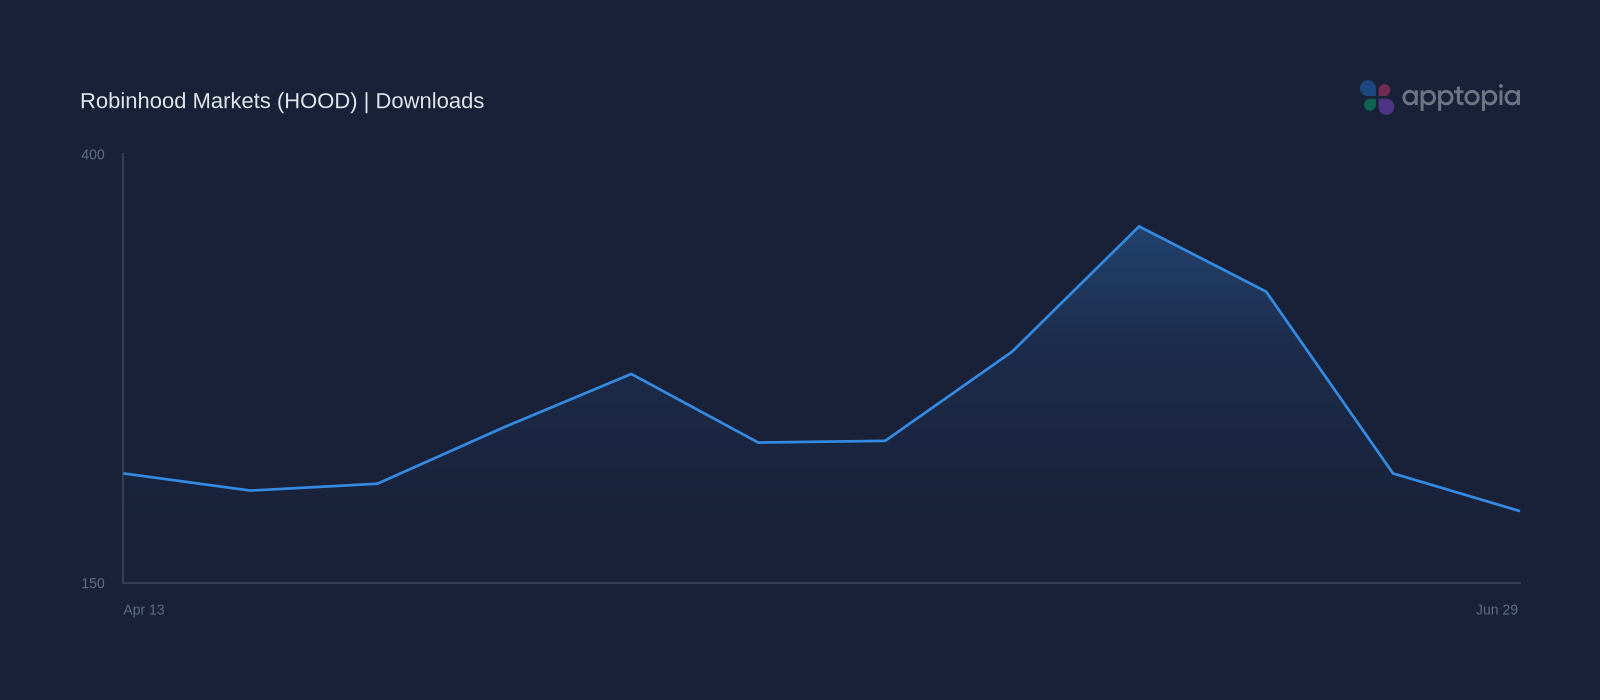
Downloads Retreated to 191.7K, Still Up 34.4% YoY
For the Week of June 29, downloads reached an estimated 191.7K, down -10.5% WoW, up 10.6% QoQ, and up 34.4% YoY.
That weekly pullback makes engagement the quality check on Robinhood’s broader acquisition trajectory.
Estimated weekly sessions reached 90.2M for Week of June 29, down -9.2% WoW, up 7.5% QoQ, and up 19.6% YoY.
For investors, sustained download growth typically precedes revenue support, while parallel engagement may support conversion potential.
Engagement Growth Shows Broader Reach With Deeper Time Spent
Robinhood’s estimated DAU reached 2.8M in Q2 2026, up 6.4% QoQ and 20.2% YoY, while MAU hit an estimated 33.7M, up 2.2% QoQ and 10.1% YoY.
Average time spent rose to an estimated 14.1 minutes per DAU, up 12.2% YoY, while average sessions per DAU was an estimated 7.8 sessions per DAU, -2.0% YoY, For investors, this mix may indicate broader reach with fewer but longer engagement occasions, supporting visibility into monetization quality.
Robinhood: Trade Anything churn signals moderate retention pressure
Robinhood: Trade Anything churn stood at an estimated 40.6% in Q2 2026, up 28.1% YoY, placing it in the moderate band and suggesting retention health has weakened versus recent baselines.
For investors, rising moderate churn typically correlates with lower recurring revenue visibility and greater CAC efficiency sensitivity, with higher user replacement needs and revenue leakage risk if sustained.
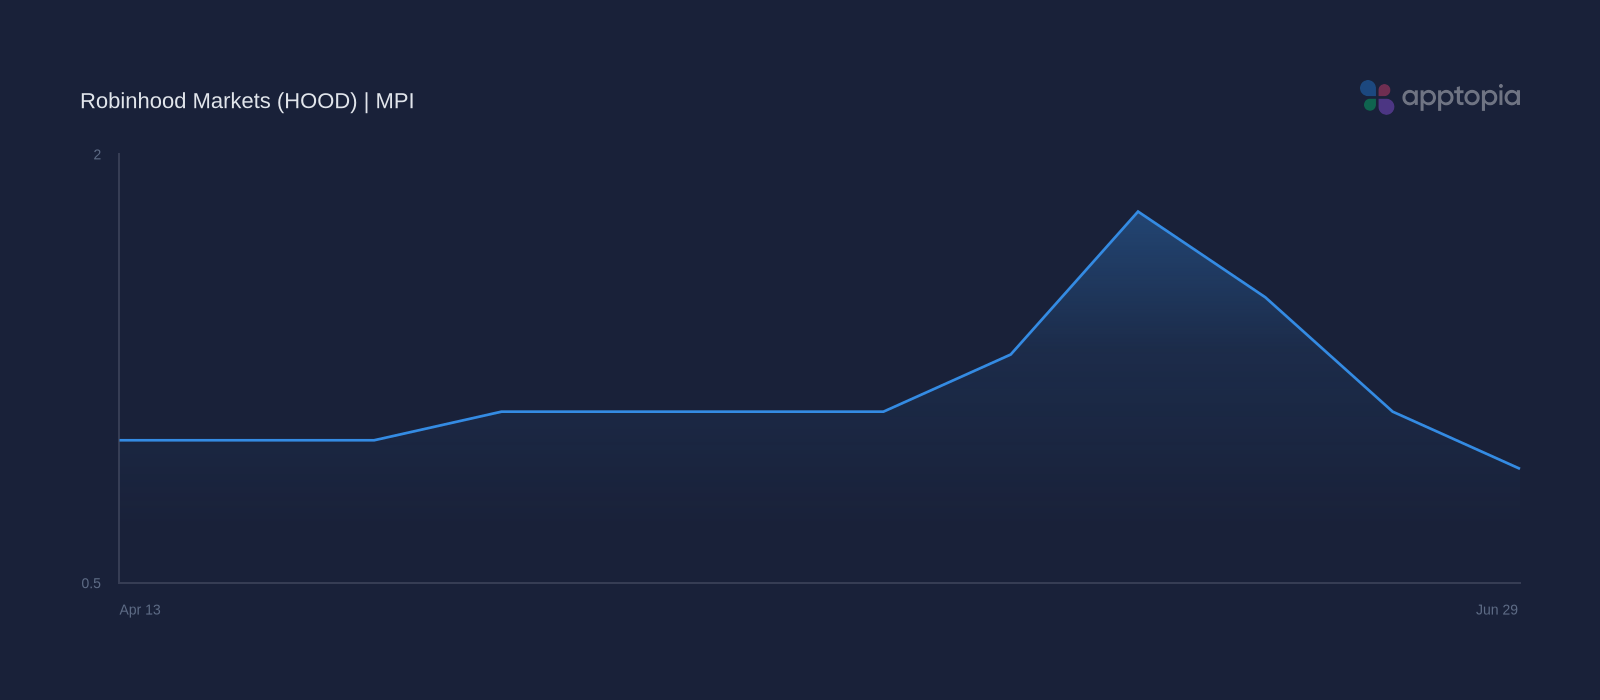
Robinhood MPI grew 9.2% YoY despite -13.6% WoW
Apptopia’s Mobile Performance Index (MPI) maps Robinhood Markets’ mobile ecosystem health to Monthly Active Users (MAU), a shareholder KPI tied to customer scale and engagement.
These correlations suggest that investors should monitor Apptopia’s data to understand how Robinhood Markets is trending for its Monthly Active Users (MAU) KPI.
Robinhood Markets’ MPI grew 4.6% QoQ and 9.2% YoY in Q2 2026, while WoW performance declined -13.6% for the Week of June 29; as Apptopia’s standalone mobile performance signal, the pattern may indicate improving quarterly momentum if weekly trends stabilize.
Investors should track Apptopia’s MPI for HOOD as a leading indicator of Robinhood Markets’ mobile momentum heading into Q2 2026.
Mixed Momentum Across Robinhood’s Mobile Funnel
Robinhood Markets’ growing MPI and constructive quarterly acquisition trends suggest a mixed mobile profile heading into Q2 2026, with broader reach and deeper time spent offset by softer session frequency and moderate estimated churn.
Apptopia’s MPI for HOOD provides a useful lens for measuring whether quarterly engagement momentum is outweighing Week of June 29 softness across downloads and sessions.
Investors should monitor Apptopia’s churn, DAU/MAU, and session metrics to gauge whether audience expansion is translating into higher-quality, more durable engagement.