
Key Takeaways:
- Netflix’s US churn rose 16.6% Y/Y in Q3 2026, about double the 7.8% increase in Q2.
- US churn has gone up seven quarters in a row, with Q3’s 8.5% quarter-over-quarter increase being the largest.
- Downloads of Netflix in the US and Canada fell 20% Y/Y in Q3, to 7.4 million.
- In APAC, downloads rose 10%, to 19.5 million. In Europe, Netflix’s churn fell 2% Y/Y in Q3.
Netflix [NFLX] reports third-quarter earnings on October 20, and engagement is the question hanging over the stock. Wells Fargo cut it to underweight on September 18 with a $57 target, citing weakening user engagement. Four days later HSBC downgraded it to hold and wrote that a “near-term recovery in engagement looks unlikely,” per Admiral Markets.
The more optimistic view came from Wolfe Research’s Peter Supino in August. He argued a soft Q2 came down to the release calendar. Shows returning in Q3 had drawn 1.3 billion viewing hours in their prior seasons, against 765 million for the Q2 slate, according to 24/7 Wall St.
Feels like Q3 should have been the better quarter. In the US, it did not drive the desired results.
Churn measures how many users who were active 30 to 60 days ago didn’t open the app in the most recent 30 days. When it goes up, more people are drifting away from the app. Netflix’s US churn rose 16.6% year over year in Q3. For the three quarters before that, it had been running about 8% higher than the year before. In Q3 that rate doubled. US churn has increased seven quarters in a row, but the first six increases were all under 5%. Q3 was up 8.5% from Q2.
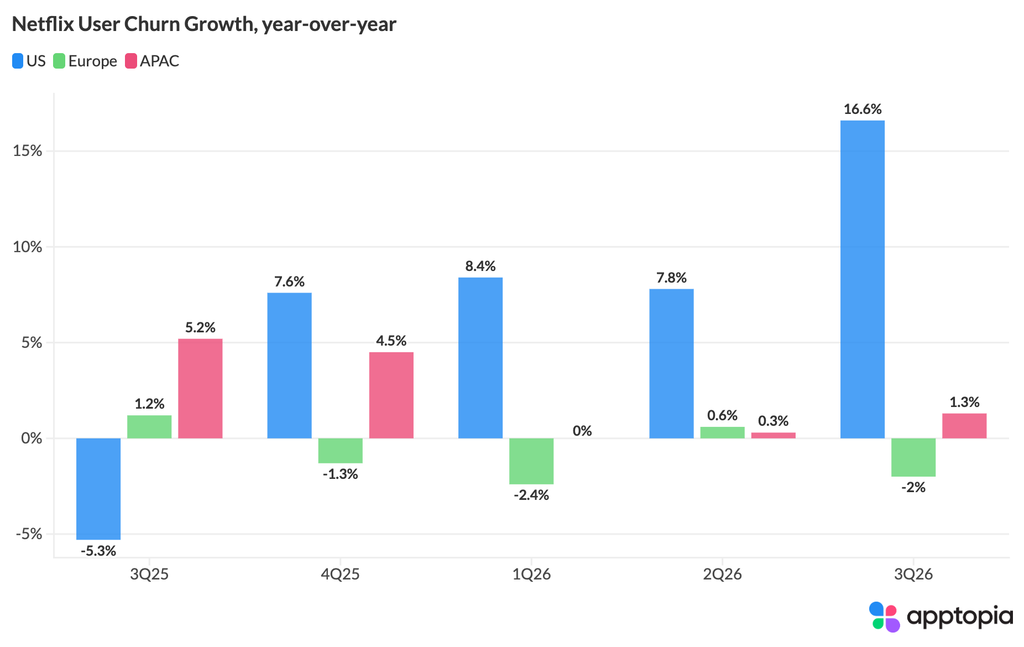
Churn rose quarter over quarter in all four age bands we track, and users 46 and older posted the biggest year-over-year increase, up 20.8%. Europe is a different picture. Netflix’s churn there fell 2.0% year over year in Q3, and it has been down year over year in three of the last four quarters. APAC churn barely moved, up 1.3%.
Downloads split in a similar fashion. Apptopia estimates Netflix’s downloads in the UCAN fell 20% year over year in Q3, to 7.4 million from 9.2 million. Q2, at 7.2 million, was the region’s softest quarter in two years. APAC went the other way, up 10% to 19.5 million, and worldwide downloads were up 1%.
In August we noted that Netflix’s US churn was up an average of 10.4% year over year. In Q3 it was up 16.6%, accelerating the negative trend.
Time spent is starting to slip too. Average Time Spent per DAU in the US was 73.2 minutes in Q3. That’s still above 70.2 minutes a year ago, but it has fallen for two straight quarters from 77.0 minutes in Q1. Rising churn normally pushes this number up, because lighter users tend to be the ones who leave and the average climbs on its own. In Q3 it went down anyway.
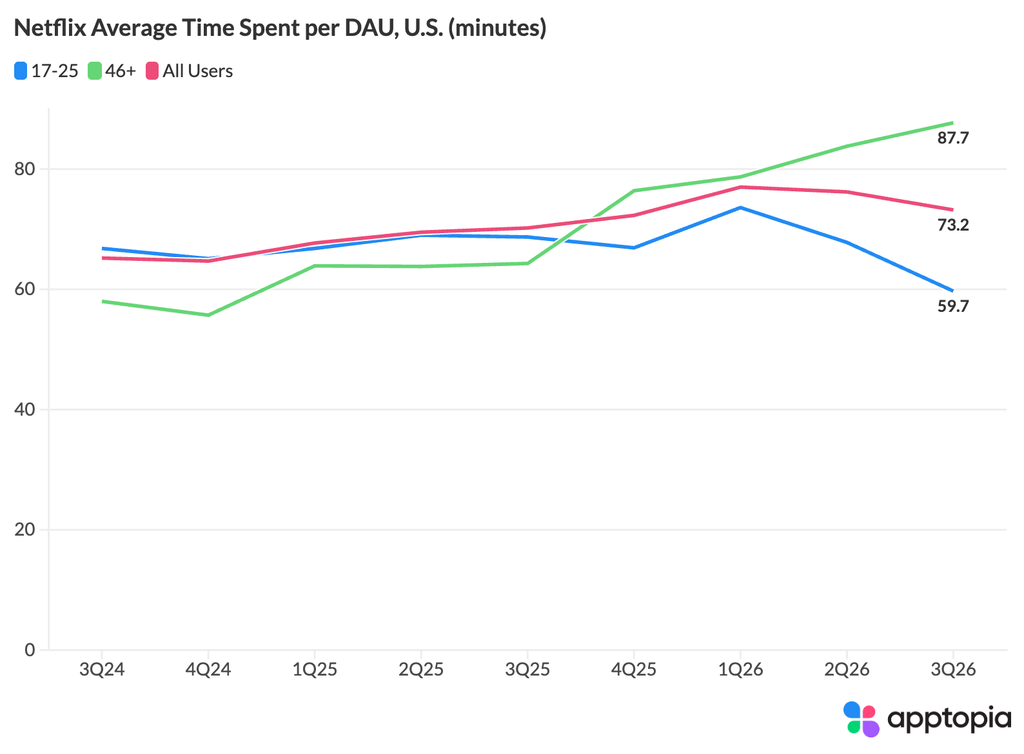
The youngest users are where it’s weakest. Netflix users aged 17 to 25 spent 59.7 minutes per day in the app in Q3, the lowest of any age group and down from 68.7 minutes a year ago. That’s the audience Netflix is chasing with YouTube creators. Bloomberg reported in August that Netflix sees YouTube stars “as a way to draw in younger viewers and boost the amount of time its users spend on Netflix,” and that YouTube is now offering creators millions to stay exclusive.
The stock has been pricing in some of this. Netflix closed at $69.70 on October 7, down about 26% this year and roughly 7% above the 52-week low of $65.08 it set in July.
Older users are moving the opposite direction. Netflix users 46 and older spent 87.7 minutes per day in the app in Q3, up from 64.3 minutes a year ago and the most of any age group. Their churn also rose faster than anyone else’s.