Apptopia

Don't Trade Trends You Don't Understand

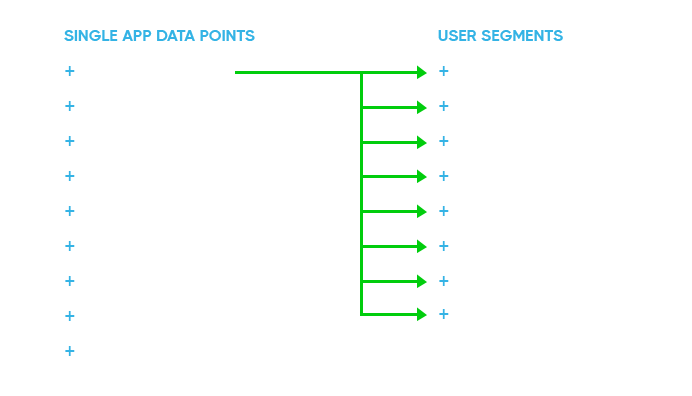
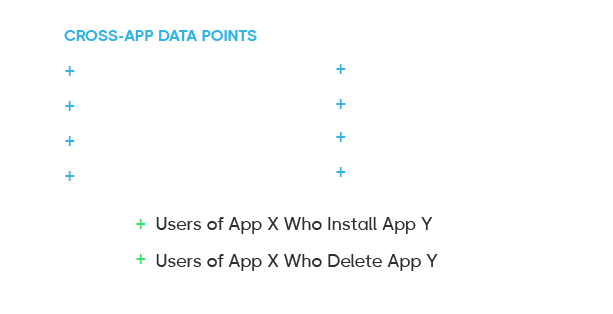
Aggregate data provides a broad picture, but it fails to reveal the underlying forces driving change. With over  70 granular data point segmentations,  Apptopia Advanced provides industry leading depth into consumer mobile behavior.  Analyze and track key user segments like power users, new users, young users churn / retention by cohort, an understanding of when time spent goes down in one app, which apps benefit, etc.
Apptopia

The chart above shows time spent of Male Users (a key segment for Roblox) correlated to the aggregate daily active users, YoY. In 4Q24 DAU rebounds from negative growth, yet Male User time spent does not. This is a major red flag, only seen with granular segmentation of the data.

Reduce your Investment Risk by Understanding the "Why" Behind the Trend Changes

Apptopia Base (App Store Intelligence)

Aggregated view of ticker-moving KPIs like DAU, MAU, Time Spent and Avg session length

Confidence:

Medium

Apptopia Advanced (Device Panel Data)

Granular segmentation from device-level data

Reveal hidden trends only known through panel data segmentation from mobile devices

Understand cross-app trends. If churn increases in one app, where are those users going?

Combine aggregate data from Apptopia Base with segmented data from Apptopia Advanced for highest investment confidence

Confidence:

High

Aggregated data, like that found in Apptopia Base, provides strong value to investors when building investment theses. Apptopia Advanced provides more granular data, revealing trends of data that are not evident when looking exclusively at an aggregated view of the data.

Apptopia Advanced:

User level data answering the why behind changes

Apptopia Advanced is a device panel data set designed for investors who demand to understand the why behind trending changes

By leveraging a massive panel of over 15 million unique devices and 5M stable users, predominantly in the US and UK, Apptopia Advanced provides access to the most granular set of data any investor focused on mobile apps demands.

What makes Apptopia Advanced’s device panel data unique?

US + UK Focus

Market leading coverage in US and UK, with maintained panel sources for US, EMEA and APAC

550+ Tickers

Coverage across the world’s most influential tickers on exchanges in US, EMEA and APAC

Stable User Base

With a stable user base of over 5M retained users the panel lets you track  behavior changes over time

Multiple Sources

Data sourced from various sources, leveraging different technologies and user incentives creates diversity

Apptopia Advanced - Single-app Analysis

Each app can be analyzed across over 70 unique data point segmentations, refined by specific user segments. This allows for deeper, more targeted insights into app performance, retention, and engagement.

Compare Average Daily Mins per User for Power Users compared to New Users, or for specific geographic areas.

All these granular data points are hidden in the typically reported aggregate KPI from the company, or the App-store Intelligence data set from Apptopia Base

Single App

Apptopia Advanced - Cross-app Analysis

Cross-app Analysis

Apptopia Advanced enables investors to analyze behavioral overlap across multiple apps, answering questions about user migration, competitive shifts, and retention patterns.

By connecting these data points between different apps on a device, investors are not only able to see where users are but where they’re going next, or where they have come from.

Understanding if time spent in one app has decreased, where that additional time spent has gone to valuable information. Or more extreme, if a user churns out and deletes one app, have they installed a different one to replace it?

Cross-app Metrics Tell a Different Story

In the chart to the right we see the cross-app usage between DraftKings and Fanduel betting apps, shown as a percentage of Fanduel users who also use DraftKings, and a percentage of users of DraftKing who also use Fanduel.

What we see is in the fall of 2023, the percentage of Fanduel users who stopped using DraftKings increased by nearly 10 percentage points (10% fewer users of both apps). This would lead us to believe that those Fanduel users were spending more time in the Fanduel app vs their DraftKings app installed on the same device.

However, in September 2024, that trend reversed, with the percentage of Fanduel users also using DraftKings increasing by nearly 15%. What drove this same co-hort to start using their DraftKings app more?

Cross App

Comprehensive coverage of the tickers investors watch

With coverage across 550+ tickers and 600+ apps, Apptopia Advanced helps investors track user engagement across the companies defining the digital economy.

ADT
Affirm
AIRBNB
Alibaba
Allscripts
Allstate
Ally
Google
Airlines
Appfolio
Apple
Applovin
Arlo
Asos
Atandt
Autotrader
Autozone
Barclays
Bathbodyworks
bjs
Blackstone
Bofa
Britishamericantobacco
Bumble
Canon
Cargurus
Ceridian
Charlesschwab
Chevron
Chewy
Chipotle
Cineworld
Citigroup
Citizensfinancial
Coinbase
Comcast
directexpress
wish
costco
cricut
cvs
dave
deliveroo
delta
dexcom
dicks
digitalturbine
dine
discover
dish
disney
dollargeneral
dollartree
dominos
doordash
draftkings
dropbox
duolingo
dutchbros
easyjet
ebay
electronicarts
embracer
entain
etsy
eventbrite
expedia
experian
facebook
fedex
fidelity
fifththird
firstgrooup
fivebeow
flutter
ford
tubi
fubo
gap
avast
generalmotors
goodrx
greggs
grifols
grindr
groupon
hewlettpackard
hilton
homedepot
hsbc
huuugegames
iheartmedia
instacart
instructure
internationalconsolidated
intuit
itv
johnson
keycorp
kohls
kroger
life360
lions
lloydsbanking
logo
lowes
lyft
m-and-t
macys
tinder2
mcdonalds
mercari
mgm
microsoft
modern
momentive
moneylion
naver
netflix
netmarble
new
corp
next
nextdoor
nike
ocado
papa
paramount2
paychex
paylocity
paypal
petco
petsathome
pintrest
fitness
playtika
poshmark
powerschool
progressive
prosieben
quotient
rakuten
recruitholdings
redfin
resmed
restaurantbrands
rightmove
robinhood
roblox
roku
rovio
salesforce
samsung
scientificgames
sciplaygames
shopify
siriusxm
skgroup
snap
sofi
softbank
sony
southwestairlines
spectrum
spinmaster
spotify
square
starbucks
stillfront
taketwointeractive
target
tcl
tdbank
tencent
tesco
tesla
tmoile
tractorsupply
trainline
truistfinancial
twitter
tylertechnologies
ubisoft
ulta
unitedcontinentalholdings
unitedhealthgroup
unitedinternet
unitedparcelservice
verizon
victorissecret
vodafone
walgreens
walmart
warnerbros
wellsfargo
wetherspoon
wise
zillow
zoom

Test drive Apptopia Advanced data

See for yourself why Apptopia is the #1 choice for investors when it comes to mobile data and predicting company performance.

By submitting this form, you agree to Apptopia’s Privacy Policy and Terms of Service.
Apptopia

advanced