Whether you’re considering a switch from Sensor Tower or looking to enhance your existing data sources, Apptopia offers the granular insights and advanced forecasting that give you the edge. Our data and models provide a deeper, more accurate understanding of app performance, empowering you to make more informed investment decisions.
Apptopia helps investors and businesses understand how mobile apps are performing by providing industry-leading insights, proprietary models and reliable data.
8 Years
Historical data
Zero
Data restatements
2,000+
Global equities covered
Advanced mobile data beyond competitors
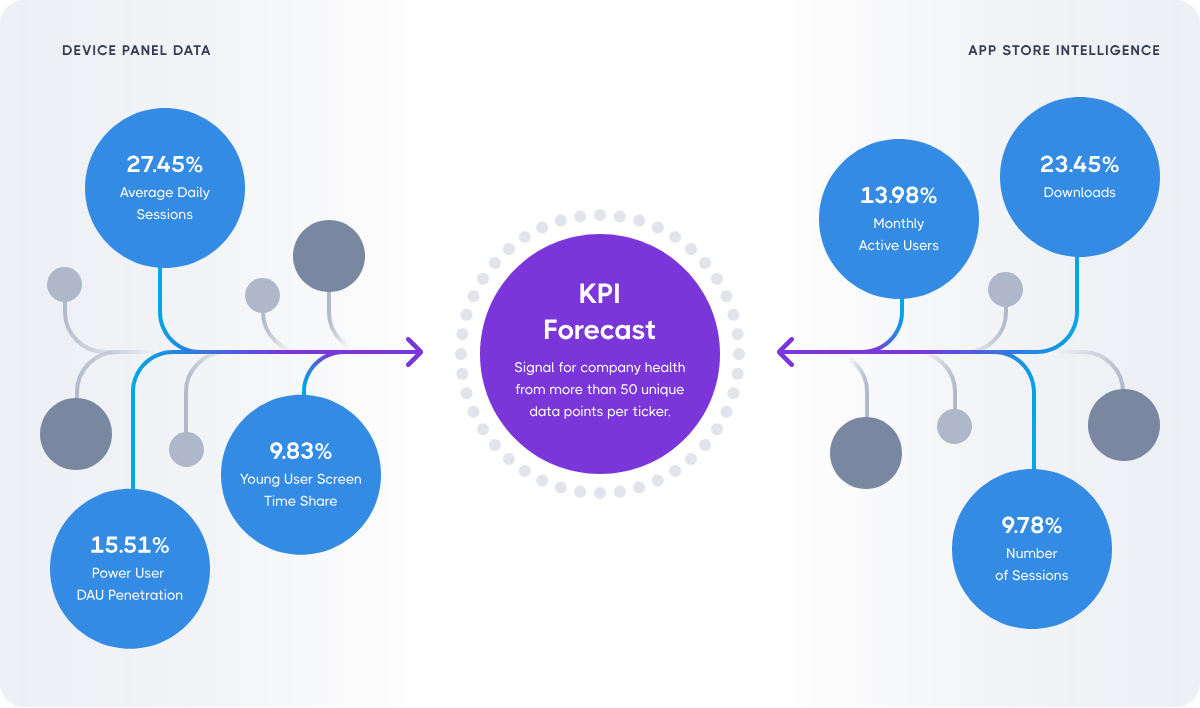
Apptopia provides a competitive edge with advanced mobile intelligence that surpasses Sensor Tower. With our proprietary data panel and KPI forecasting, we deliver insights into market and company performance at an unmatched level of granularity.
Access data from 4 million devices and 190 apps across 20 key sectors—updated daily for the most accurate, actionable intelligence available.
Granular data for detailed analysis
Apptopia’s Advanced data product offers unparalleled granularity, delivering 48 unique data points per app, including DAU, MAU, sessions, screen time, churn, and more.
Our data allows you to analyze user behavior at a highly detailed level—by demographic, region, or custom segment—giving you the insights needed to understand and predict market performance with precision.
Trusted by global leaders
Top companies rely on Apptopia’s data to make strategic decisions. Our intelligence supports both corporate clients and financial services, delivering insights that help firms track performance, predict outcomes, and stay ahead of the market.
“Apptopia plays an important role in our entire investment process. Their alternative data, correlations, and willingness to discuss the data give us a bigger picture of the market.”
Chirayu Patel, Founder, Rakani Capital
Research-driven KPI Forecasting
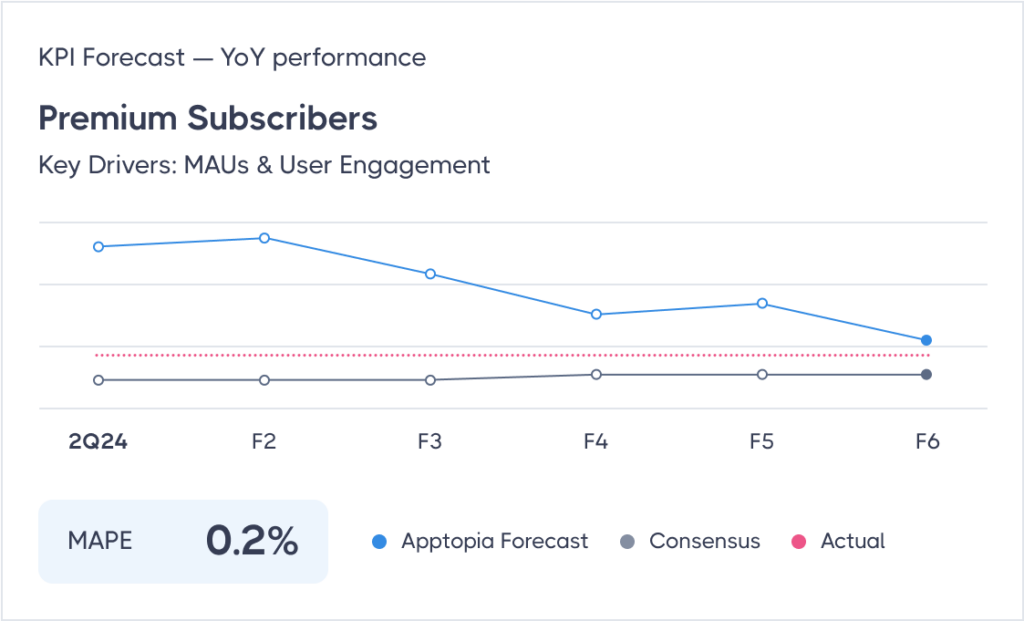
Our KPI Forecasts leverage Apptopia’s proprietary data to deliver accurate, research-driven company performance predictions. These forecasts are updated bi-weekly and are delivered 2-3 times faster than market consensus.
With a track record of 70%+ accuracy, our KPI forecasts empower you to make faster, more informed investment decisions.
Low MAPE for higher confidence
Apptopia’s KPI Forecasts consistently deliver some of the lowest Mean Absolute Percentage Errors (MAPE) in the industry, with an r-squared value of 0.99 for several tickers.
Our models are designed to minimize error while providing clear, actionable insights into the health of leading companies. Trust Apptopia to guide your investment strategy with precision and confidence.
Our models generate industry-leading correlations for the world’s leading apps
Diverse data sources for reliable insights
Apptopia’s panel includes 4 million real users from both iOS and Android, delivering the most comprehensive view of mobile usage across the globe.
With historical data going back to January 2021, we provide an ongoing, reliable feed of user behavior, demographics, and app performance data—all updated daily with a 4-day lag.
Data integrity and long-term reliability
At Apptopia, we ensure long-term stability and integrity in our data. With over eight years of historical data, our datasets are perfect for quants seeking consistent, high-quality inputs for their models.
Our approach prioritizes sustainability, making sure that the data you rely on remains accurate and actionable over time.
Custom solutions for specialized needs
For clients with specific needs, Apptopia offers white-glove service with custom data cuts and reports.
Whether you need cross-app analysis, regional trends, or user behavior tracking, we deliver insights tailored to your precise requirements, ensuring you have the data you need to make informed decisions.
Get access to market-moving insights
Request data on tickers you cover and receive a CSV and analyst support for your own analysis.
By submitting this form, you agree to Apptopia’s Privacy Policy and Terms of Service.