Apptopia’s proprietary blend of deep consumer signals for growth, engagement, and user segmentation, into a single index. MPI is the only metric you truly need to understand mobile data impact for any public company.
Apptopia’s proprietary blend of deep consumer signals for growth, engagement, and user segmentation, into a single index. MPI is the only metric you truly need to understand mobile data impact for any public company.
Apptopia’s Mobile Performance Index combines individual consumer mobile data variables curated for a specific tickers, delivering a powerful signal that is simple and maintains industry-leading YoY correlations for 300+ KPIs .
0.90+ average correlation across all Mobile Performance Indexes
The strongest correlations between index and KPI available Today
Industry-leading stability of correlations
1:1 correlations that eventually fail; by combining multiple metrics, correlation remains consistent and reliable quarter after quarter
Proprierty Metrics Deliver peerless results
By leveraging Apptopia Advanced device panel datapoints, we’re exclusively able to create the most powerful combinations of metrics
daily updates to data ensures fresh correlations
The underlying data for MPIs are updated daily on a 24-hour lag
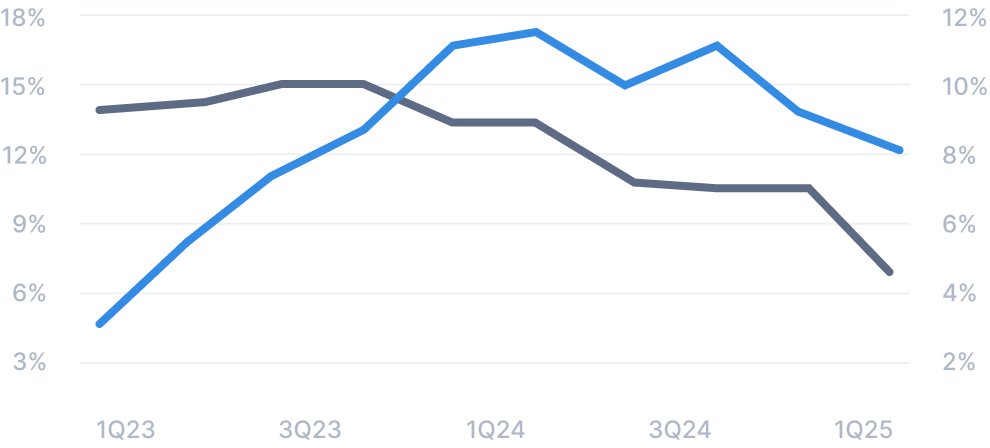
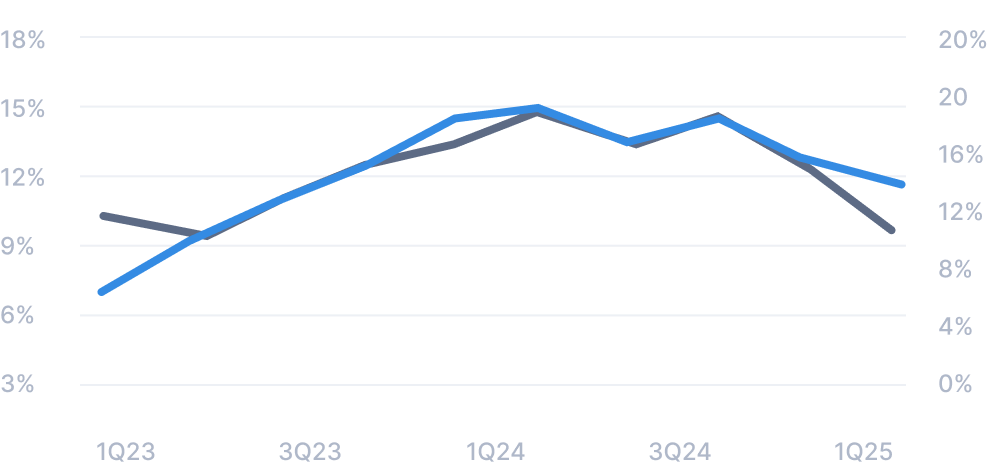
One Metric. Unmatched Year-over-Year Insight.
Traditional correlations between a single data point and Company KPI work, until they don’t. With Mobile Performance Indexes, we deliver the market’s most robust year-over-year correlation — one resilient metric that stays meaningful even as each company’s growth drivers evolve.
Step 01
Research Public KPIs
Cluster public companies by their KPI type and develop a unique model for each group.
Step 02
Discover Datapoints
Discover data points that both make fundamental sense and show an independent relationship with the KPI.
Step 03
Produce MPI
Combine data points in Step 2 in a proprietary way to produce the Mobile Performance Index.
Customers
(eg Subscribers, Active Users, Rewards Members, etc.)
Growth + Engagement + Churn
Customers
(eg Subscribers, Active Users, Rewards Members, etc.)
Growth + Engagement + Churn
Revenue
(eg Total Revenue, Ad Revenue, Digital Revenue, etc.)
Users + Cumulative Activity + Impact Segment
Revenue
(eg Total Revenue, Ad Revenue, Digital Revenue, etc.)
Users + Cumulative Activity + Impact Segment
Transactions
(eg Orders, Rides or Nights Booked, etc.)
Growth + Engagement Frequency + Power Users
Transactions
(eg Orders, Rides or Nights Booked, etc.)
Growth + Engagement Frequency + Power Users
15% increase in YoY correlation strength
By combining diverse metric signals into a single value (MPI), overall correlation strength improved by 15%
The Simplicity of an Index, Matched with the Alpha Potential of Complete Datasets
Apptopia’s Mobile Performance Indexes blends two purposefully selected data points that when combined, provide the best correlation to a company’s KPI
Airbnb, Inc.
ABNB
Industry Standard
Correlation of a single metric vs Nights & Experiences Booked
0.30 YoY Correlation
Mobile Performance Index (MPI)
Proprietary blend of multiple data points vs Nights & Experiences Booked
0.90 YoY Correlation
Netflix
NFLX
Industry Standard
Correlation of a single metric vs Nights & Experiences Booked
0.48 YoY Correlation
Mobile Performance Index (MPI)
Proprietary blend of multiple data points vs Ending Subs
0.98 YoY Correlation
Match Group, Inc.
MTCH
Industry Standard
Correlation of a single metric vs Payers — Tinder
0.50 YoY Correlation
Mobile Performance Index (MPI)
Proprietary blend of multiple data points vs Payers — Tinder
0.94 YoY Correlation
Get a sample of our Mobile Performance Index data
See for yourself what granular, device panel data reveals for your investment hypothesis.
Never miss an insight. Get quality content sent to your inbox every week.
Introducing:
Mobile Performance Index (MPI)
Apptopia’s proprietary blend of deep consumer signals for growth, engagement, and user segmentation, into a single index. MPI is the only metric you truly need to understand mobile data impact for any public company.
Apptopia’s proprietary blend of deep consumer signals for growth, engagement, and user segmentation, into a single index. MPI is the only metric you truly need to understand mobile data impact for any public company.
Apptopia’s Mobile Performance Index combines individual consumer mobile data variables curated for a specific tickers, delivering a powerful signal that is simple and maintains industry-leading YoY correlations for 300+ KPIs .
0.90+ average correlation across all Mobile Performance Indexes
The strongest correlations between index and KPI available Today
Industry-leading stability of correlations
1:1 correlations that eventually fail; by combining multiple metrics, correlation remains consistent and reliable quarter after quarter
Proprierty Metrics Deliver peerless results
By leveraging Apptopia Advanced device panel datapoints, we’re exclusively able to create the most powerful combinations of metrics
daily updates to data ensures fresh correlations
The underlying data for MPIs are updated daily on a 24-hour lag
One Metric. Unmatched Year-over-Year Insight.
Traditional correlations between a single data point and Company KPI work, until they don’t. With Mobile Performance Indexes, we deliver the market’s most robust year-over-year correlation — one resilient metric that stays meaningful even as each company’s growth drivers evolve.
Step 01
Research Public KPIs
Cluster public companies by their KPI type and develop a unique model for each group.
Step 02
Discover Datapoints
Discover data points that both make fundamental sense and show an independent relationship with the KPI.
Step 03
Produce MPI
Combine data points in Step 2 in a proprietary way to produce the Mobile Performance Index.
Customers
(eg Subscribers, Active Users, Rewards Members, etc.)
Growth + Engagement + Churn
Customers
(eg Subscribers, Active Users, Rewards Members, etc.)
Growth + Engagement + Churn
Revenue
(eg Total Revenue, Ad Revenue, Digital Revenue, etc.)
Users + Cumulative Activity + Impact Segment
Revenue
(eg Total Revenue, Ad Revenue, Digital Revenue, etc.)
Users + Cumulative Activity + Impact Segment
Transactions
(eg Orders, Rides or Nights Booked, etc.)
Growth + Engagement Frequency + Power Users
Transactions
(eg Orders, Rides or Nights Booked, etc.)
Growth + Engagement Frequency + Power Users
15% increase in YoY correlation strength
By combining diverse metric signals into a single value (MPI), overall correlation strength improved by 15%
The Simplicity of an Index, Matched with the Alpha Potential of Complete Datasets
Apptopia’s Mobile Performance Indexes blends two purposefully selected data points that when combined, provide the best correlation to a company’s KPI
Airbnb, Inc.
ABNB
Industry Standard
Correlation of a single metric vs Nights & Experiences Booked
0.30 YoY Correlation
Mobile Performance Index (MPI)
Proprietary blend of multiple data points vs Nights & Experiences Booked
0.90 YoY Correlation
Netflix
NFLX
Industry Standard
Correlation of a single metric vs Nights & Experiences Booked
0.48 YoY Correlation
Mobile Performance Index (MPI)
Proprietary blend of multiple data points vs Ending Subs
0.98 YoY Correlation
Match Group, Inc.
MTCH
Industry Standard
Correlation of a single metric vs Payers — Tinder
0.50 YoY Correlation
Mobile Performance Index (MPI)
Proprietary blend of multiple data points vs Payers — Tinder
0.94 YoY Correlation
Get a sample of our Mobile Performance Index data
See for yourself what granular, device panel data reveals for your investment hypothesis.