Key Takeaways:
- Grok’s sequential growth is re-accelerating. US downloads rose 29% quarter-over-quarter in Q1 2026 after a slower Q4, and global daily active usage jumped 56% QoQ. X is adding US users faster at the same time. The platform’s US daily active usage grew 28% year-over-year in Q1 2026.
- Grok is getting some users from X but is mostly building an independent user base.
- The only concern is that user churn remains elevated. Grok’s absolute churn level is high, and X’s user churn has increased for eight straight quarters.
SpaceX filed confidentially for what could be the largest IPO in history on April 1. It’s a combined SpaceX-xAI entity targeting a $2 trillion valuation. Starlink’s 9M+ subscribers and the launch business will anchor most of that number. But investors will still need to size two consumer-facing products now inside the same corporate wrapper: Grok and X.
Grok: Sequential momentum
Year-over-year comparisons are less helpful for an app that had its first full quarter in Q1 2025. Sequential trends tell the real story, and they’re encouraging. US downloads grew 29% QoQ in Q1 2026, an acceleration from the 13% QoQ growth in Q4. Globally, daily active usage rose 56% QoQ after a 29% gain the prior quarter.
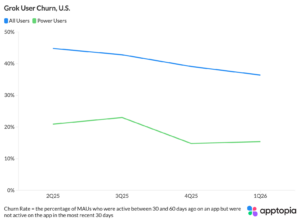
Retention is improving quarter by quarter. US user churn dropped from 45% in Q2 2025 to 36% in Q1 2026. It’s still high in absolute terms, but it has trended down for four consecutive quarters, a positive sign for user health. When Apptopia talks about user churn, it is a usage statistic and is not a 1:1 for paying subscribers. Power User (top 10% of users by time spent) churn fell sharply from 21% to 15.%, and average daily time spent by Power Users doubled from roughly 58 minutes to nearly 2 hours over the same period. Grok is converting casual users into committed ones.
There is concern over the audience’s composition. As of February 2026, 82% of Grok’s US weekly active users were male. ChatGPT, for example, was 50% male while Gemini was 45% male. Grok’s male concentration had actually been falling but it could limit the addressable market and complicate advertiser interest should Grok pursue advertising revenue. You can learn more about Grok’s competitive position in its market here.
X: More engagement, more exits
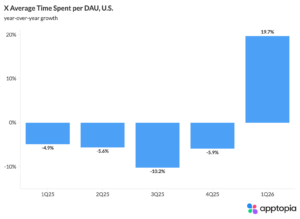
X had a strong Q1 on the surface. US daily active usage reached a two-year high, rising roughly 28% year-over-year and 6% sequentially. Average Time Spent per DAU user climbed to just over 30 minutes daily, up from 26 minutes a year ago. Power Users averaged nearly 2 hours and 44 minutes. Global trends have been directionally the same as those in the US.
However, there is some underlying tension. Time spent per daily user and churn rate are both climbing — a pattern that suggests X is getting more out of the users who stay, but losing a growing share each quarter. US user churn has risen every quarter since Q1 2024, from 14% to 20%. To combat this, X has been getting strong new user growth. Downloads in 1Q26 hit their highest level since 4Q24. That said, for an app with this long a history, downloads growth seems like only a short-term solution for replacing lost users. Eventually, this increasing pressure on new user acquisition just to maintain the base will boil over.
There is one spark of hope for X in the churn data. Power User churn, typically the most stable cohort on any social platform, improved to 4% in Q1 2026 from 5% in Q4 2025. Perhaps X can take some learnings from that improvement and leverage it for the rest of its users. Still, 4% Power User churn is well above the 3% level seen two years ago.
Where the user bases meet
An easy assumption is that X serves as a feeder system for Grok — users discover the chatbot through X’s integration and migrate over. The data partially support this. We’ve analyzed this in two ways: sequential sessions and cross-app overlap. Sequential sessions looks at how many sessions of Grok came after directly a session on X. We found that while the percentage of X app sessions that immediately lead to sessions on Grok is small (less than 1%), that number has doubled since December. Measuring cross-app overlap, the share of X’s US users who also use Grok climbed from 2% to 5% over the past three quarters.
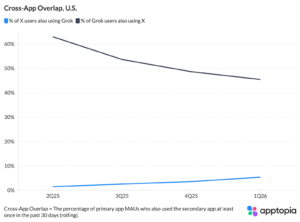
But the reverse trend complicates the feeder narrative. The share of Grok users who also use X dropped from 63% to 46% over the same period. Grok is increasingly acquiring users who never touch X. That’s a positive signal for Grok’s standalone value within the SpaceX portfolio. This suggests that while X is a growing source of traffic for Grok, it does not depend on it in any way.
“The fact that Grok’s churn rate has dropped eight points in four quarters is more telling than any year-over-year growth number,” said Tom Grant, VP of Research at Apptopia. “For an app this young, the sequential retention improvement matters more than the absolute level. The open question is whether that curve flattens or continues to compress.”
X and Grok will represent a fraction of the SpaceX IPO’s valuation while Starlink and the launch business are its headliners. But they’re the pieces most visible to consumers and most subject to competitive pressure. The data suggest both are growing, neither is fully healthy, and the relationship between them is still taking shape. To learn more about Starlink, click here.