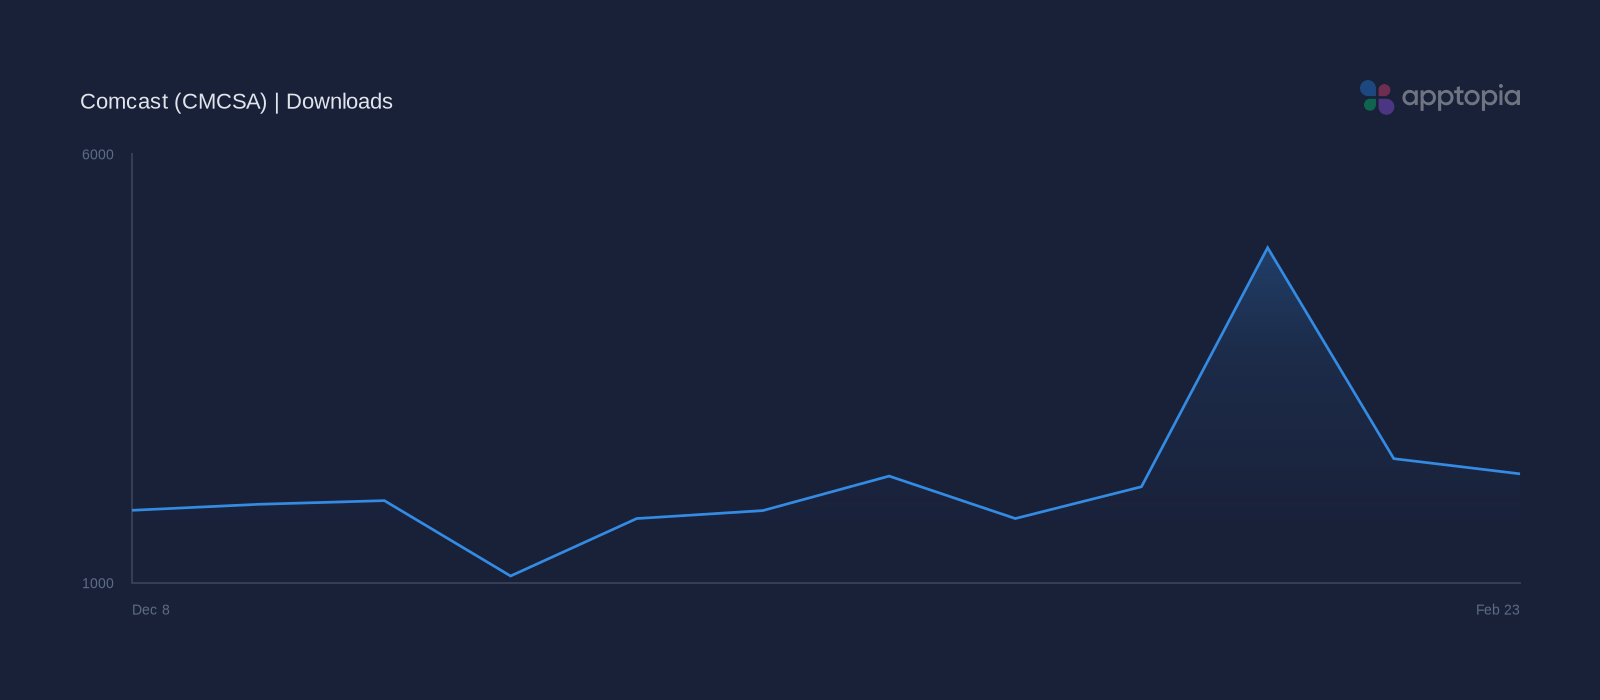
Downloads Retreat 4.6% YoY Amid Mixed Momentum
For the week of February 23, Comcast downloads reached an estimated 2.3M, falling -7.2% WoW even as Q4 2025 volumes of 29.2M grew 1.8% QoQ but declined -4.6% YoY, while sessions of approximately 343.8M dipped -1.5% WoW against Q4 2025 growth of 1.4% QoQ and 1.9% YoY.
This mix of softer YoY downloads with steadier quarterly gains and resilient session growth may indicate broadly stable acquisition with emerging top-of-funnel pressure, and for investors, the combination of declining YoY installs alongside firm engagement typically signals a risk of slower new-user-driven revenue expansion if the pattern persists.
DAU softness contrasts with expanding reach and deeper engagement
In Q4 2025, Comcast’s DAU reached an estimated 8.9M, rising 2.2% QoQ even as YoY growth was slightly negative at -0.1%, while MAU expanded to approximately 118.6M, up 4.4% QoQ, and analyst estimates indicate that avg sessions per DAU and avg time spent per DAU climbed 14.0% and 23.7% YoY, respectively, suggesting broadening reach alongside improving engagement depth.
For investors, this pattern of MAU expansion combined with rising time spent per DAU typically correlates with improving monetization potential if sustained, though the flat-to-down DAU YoY indicates that revenue upside may increasingly depend on ARPU gains and conversion efficiency.
Churn at 49.7% signals moderate but potentially weakening retention
Peacock TV: Stream TV & Movies posted an estimated user churn rate of 49.7% in Q4 2025, a moderate level that suggests mixed and potentially weakening retention quality, while the 11.4% YoY increase in churn may imply meaningful revenue leakage and rising re-acquisition demands that could pressure margins if sustained.
For investors, this pattern may signal less predictable subscription and advertising monetization over time, as well as weaker CAC payback if higher marketing spend is required to offset the elevated attrition.
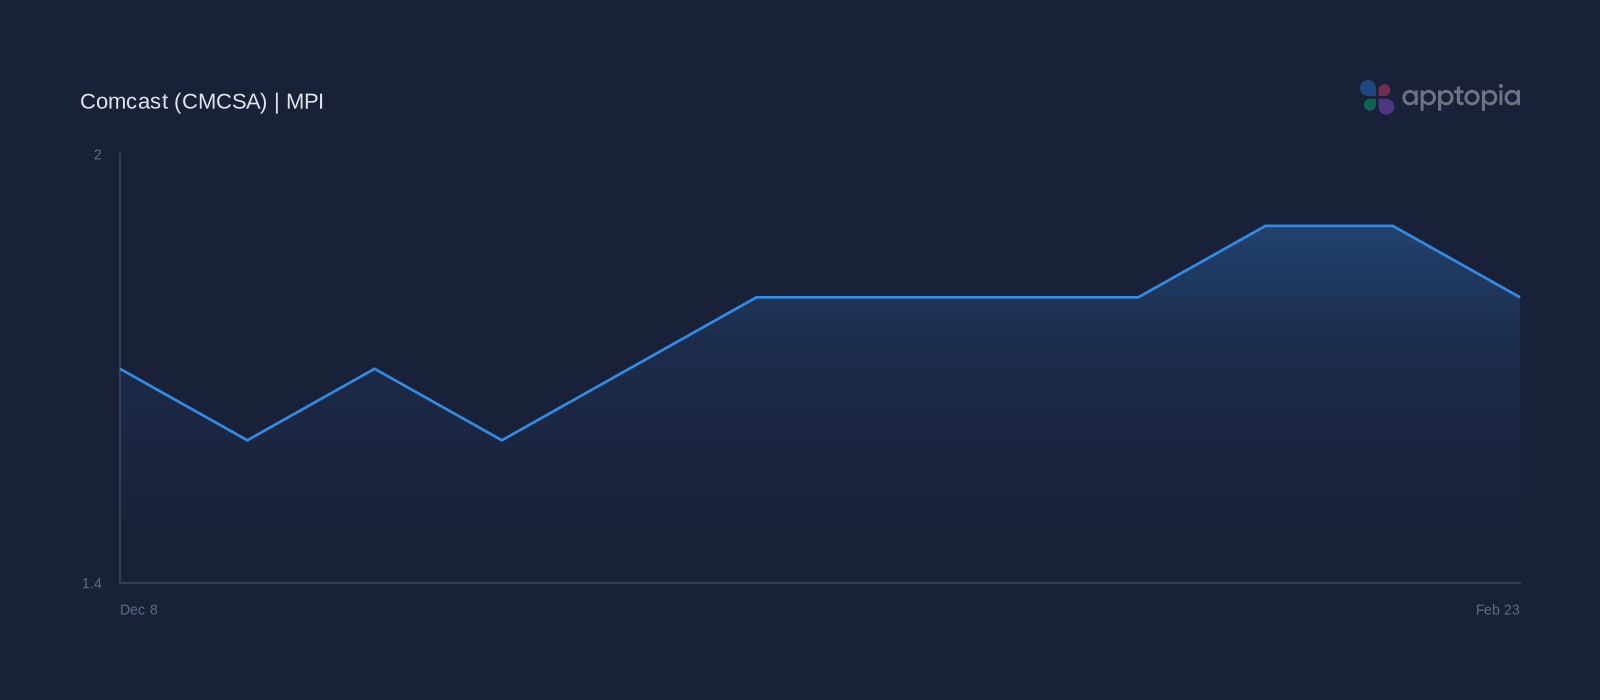
Comcast MPI held steady with -8.8% WoW softness
One of the key metrics investors track for Comcast (CMCSA) is its Total Customer Relationships KPI, which the company highlights in SEC filings as a primary gauge of subscriber scale and engagement that often drives the performance of the stock.
Among the hundreds of app signals Apptopia models, Apptopia’s Mobile Performance Index (MPI) was selected for Comcast due to its historical alignment with Total Customer Relationships disclosures and stock performance over multi-year periods, suggesting that shifts in MPI around Q4 2025 and the Week of February 23 may indicate changes in subscriber momentum.
These correlations suggest that investors should monitor Apptopia’s data to understand how Comcast is trending for its Total Customer Relationships KPI.
Comcast’s Mobile Performance Index was stable overall in Q4 2025, with modest growth of 1.1% QoQ and 3.1% YoY even as the Week of February 23 saw a -8.8% WoW decline that may signal near-term volatility within a largely flat two-year range.
For investors, this generally range-bound Apptopia MPI pattern typically correlates with more contained stock reactions unless an inflection emerges, and investors should monitor Apptopia’s MPI for CMCSA to gauge whether stable momentum continues into Q1 2026.
Mixed Mobile Momentum With Retention Headwinds
Comcast’s mobile metrics show a mixed profile heading into Q1 2026, with a stable Apptopia MPI, broadly steady acquisition, and expanding reach offset by moderate but deteriorating churn that may be pressuring overall retention quality.
Apptopia’s MPI for CMCSA is a useful way to measure how this largely flat engagement trend balances against softer weekly signals and rising attrition.
Investors should use Apptopia’s data to track whether stable MPI, resilient sessions, and MAU expansion can counterbalance elevated churn as they gauge the quality of Comcast’s mobile growth.