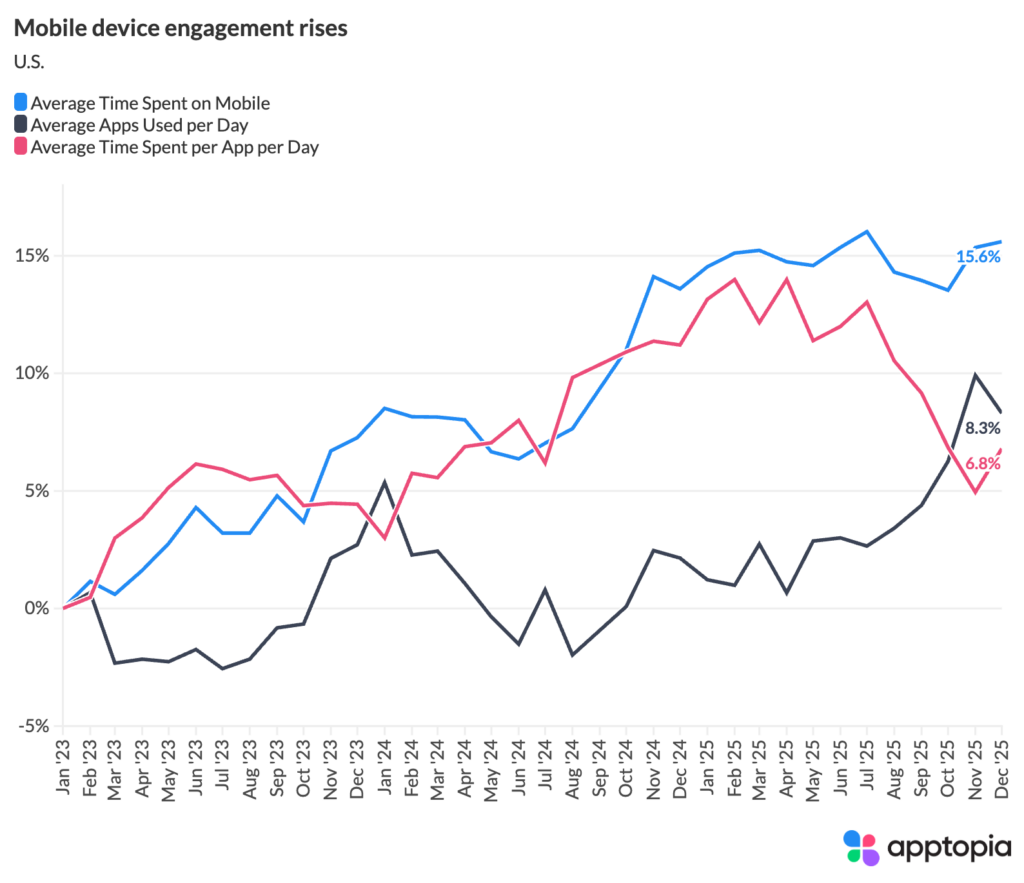
We took a look at Apptopia’s U.S. consumer panel data spanning January 2023 through December 2025 to understand high-level trends in mobile time spent, app usage and engagement depth. The big number is 6.3 hours per day. That is the average amount of time people are spending using their mobile phones each day. If you assume 8 hours of sleep each day, that’s 39% of the day devoted to being on your mobile device.
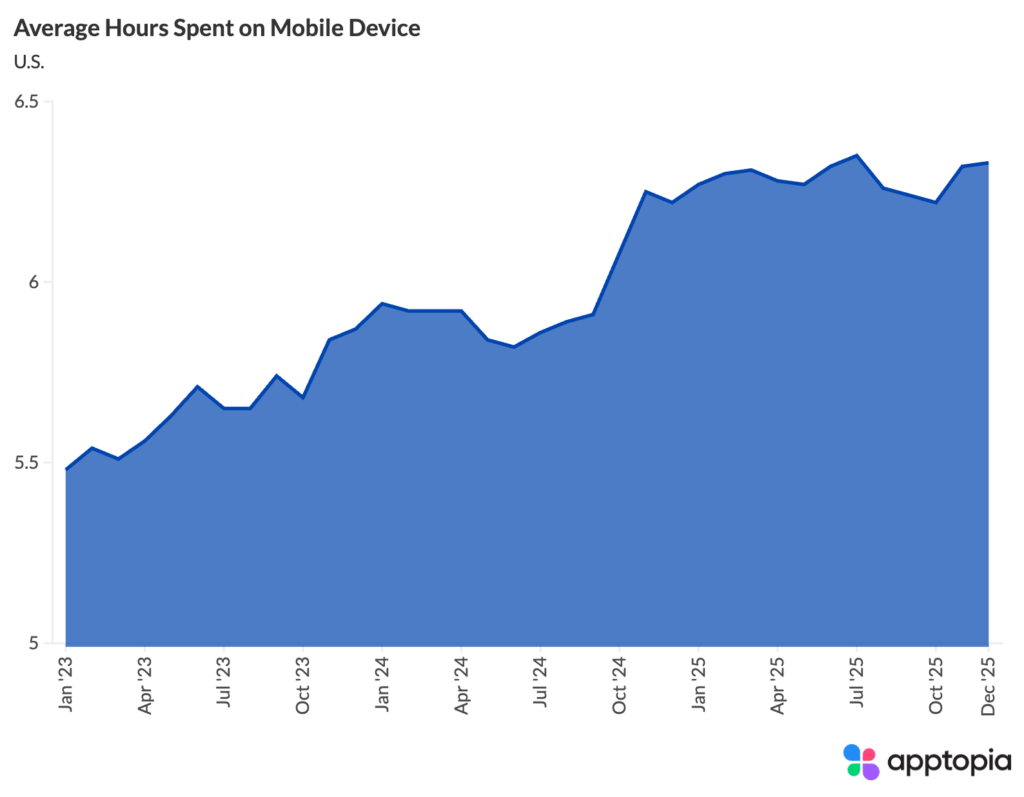
The average U.S. mobile user spent 5.5 hours per day on their phone in January 2023. By December 2025, that figure climbed to 6.3 hours, an increase of nearly 51 minutes per day, or about 15.6%. To put it differently, Americans are now spending roughly 190 hours per month on mobile. That’s more than a full-time work week every month, just on your phone. Although, it does feel weird to still be calling it a phone, doesn’t it?
To have a moment of self-promotion, I have to say that for investors in consumer businesses, this makes mobile consumer activity data even more valuable to your investment theses.
Older users flipped the script
Now here’s the finding I didn’t expect. In January 2023, younger users averaged 288 minutes per day versus 281 for older users, a small but expected gap. Everyone assumes the kids are glued to their phones. But starting around mid-2024, older users overtook younger users in daily screen time and never looked back.
Younger users are defined as those being aged 17-25. Older users are being defined as those aged 36+.
By the end of 2025, older users were consistently logging 340 to 358 minutes per day, often outpacing younger users by 10 to 17 minutes. In July 2025, the gap hit its widest: older users at 341 minutes versus 325 for younger. Older users surpassed younger users for time spent in 14 of the last 17 months of the dataset.
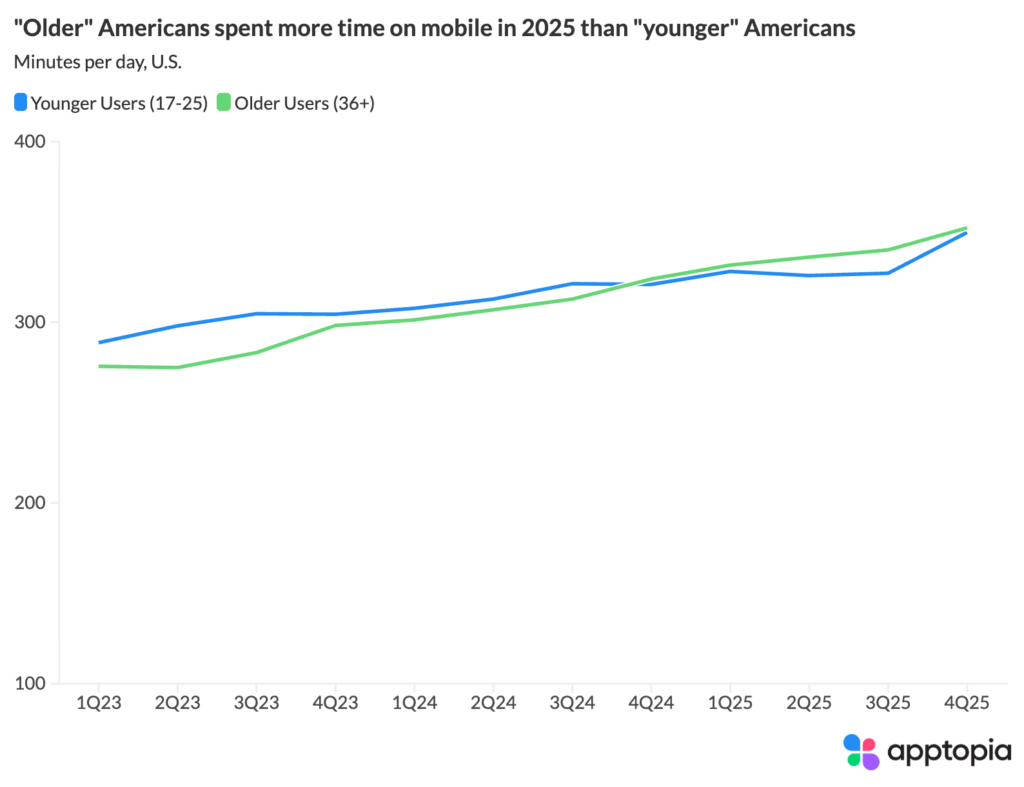
Over the full period, older users grew their daily time by 27.5%, compared to 24.9% for younger users. It’s hard to know exactly why this is happening but I have two theories. The first is that younger Americans are actively trying to disengage from technology. The other is that there is increasingly an app for everything mundane in life, which tend to be things older users would be leveraging. These are called companion apps. Think of dishwashers, house lights, hearing aids, grills, toothbrushes, etc.
But younger users go deeper
While older users spend more total time, they spread it across more apps. Older users went from opening about 15 apps per day in early 2023 to more than 17 by the end of 2025, a 13.4% increase.
Younger users are opening fewer apps, roughly 14.6 per day, but spend 25.4 minutes per app, which is 59% more per-app time than the overall average. They’re locked into their sessions. For platforms competing for younger eyeballs, this means you either win big or you’re invisible. There’s less room in the middle.
The 90+ minute apps are on the rise
Looking at the distribution of how much time apps on a person’s device receive each month, the 90+ minute bucket grew the fastest, from about 8 apps per device in January 2023 to nearly 10 by December 2025. That’s a 24.6% increase. Meanwhile, light-touch apps receiving under 5 minutes per month barely budged, growing just 1.4%.
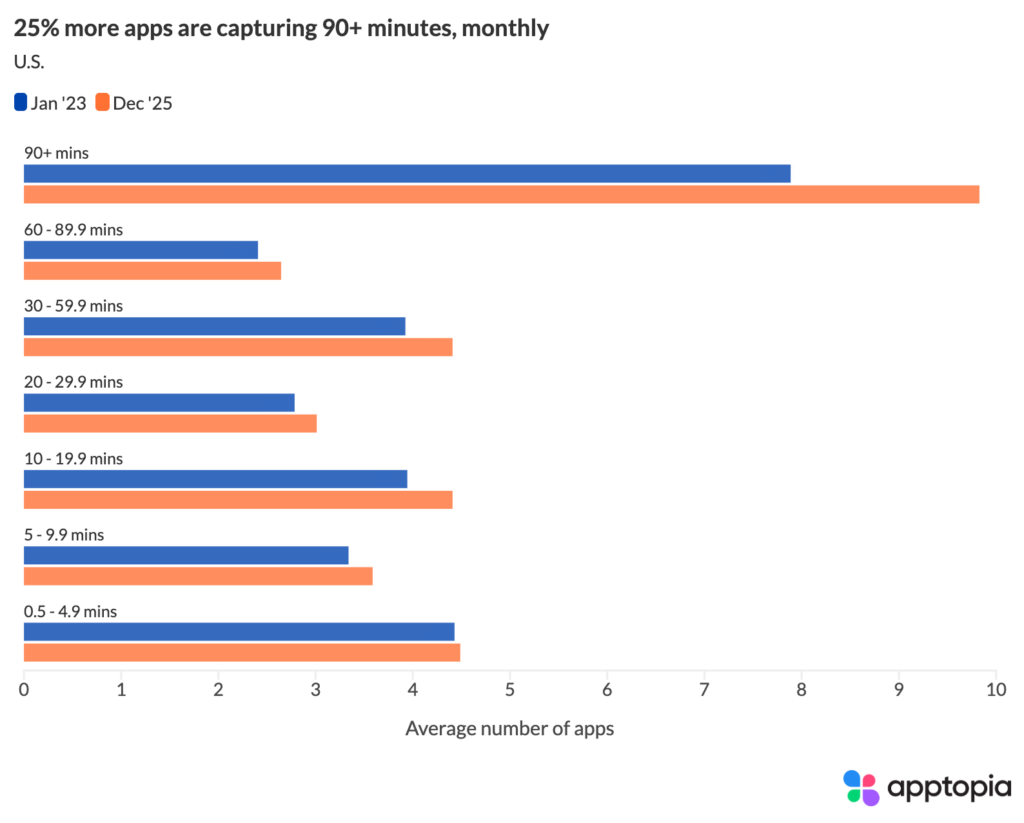
This means consumers are adding apps that command real time. The share of apps in that 90+ minute tier rose from 27.5% of all used apps to 30.4%. Almost one in three apps on the average device is now getting an hour and a half or more of attention per month. These are typically apps like Netflix, YouTube, TikTok, Google Maps, mobile games, etc.
Mobile data’s growing importance for investors
This data reframes how you should think about the mobile consumer wallet and attention pool. The total addressable time grew 15.6% in three years with no signs of flattening. The older user surge has real revenue implications. Older consumers tend to have higher disposable income and higher average order values. The fact that this cohort grew mobile time by 27.5% and now uses 17+ apps per day means they are increasingly reachable and transactable through mobile.