Hey there, thanks for coming to the blog. If you’re interested in this topic but you were hoping for fresher data, we certainly have it. Please reach out to humans@apptopia.com and we’ll see what information we can provide!
We recently developed Sessions data, and this research is our first dive into those numbers for you guys. We’ve compiled the apps and games with the most total time spent over the past three months. Total time for a given app simply means all time combined for everyone who used that app in a given time period. Looking at our findings below, the first thing you will surely notice is the app leader, WhatsApp (85.21 billion hours) has far and away more hours spent in-app than our leading game, Clash of Clans (3.83 billion hours).
While games are known to rake in the most money through in-app purchases, they are not necessarily where app users are spending most of their time. Stating the obvious, more people use apps like Facebook and Pandora than the top games leading to a massive difference in worldwide time spent between games and non-games.
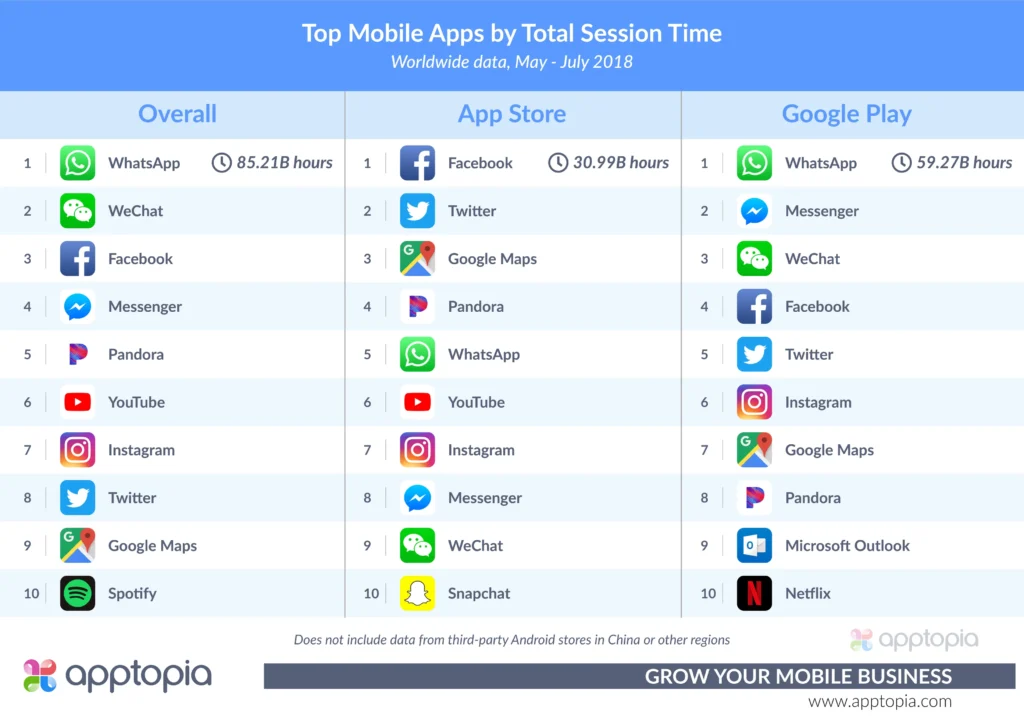
Keeping in mind that our data excludes third party Android stores from China and other regions, it’s clear WhatsApp is the global messaging app of choice. Apps having to do with communication take up most of our time spent on our mobile apps. Streaming apps (YouTube, Pandora, Spotify, Netflix) also have a strong presence here. Something else to notice is the share of your time that Facebook has, as it owns 4 of the top 10 apps in our Overall category. Google comes to the table with two – YouTube and Google Maps.
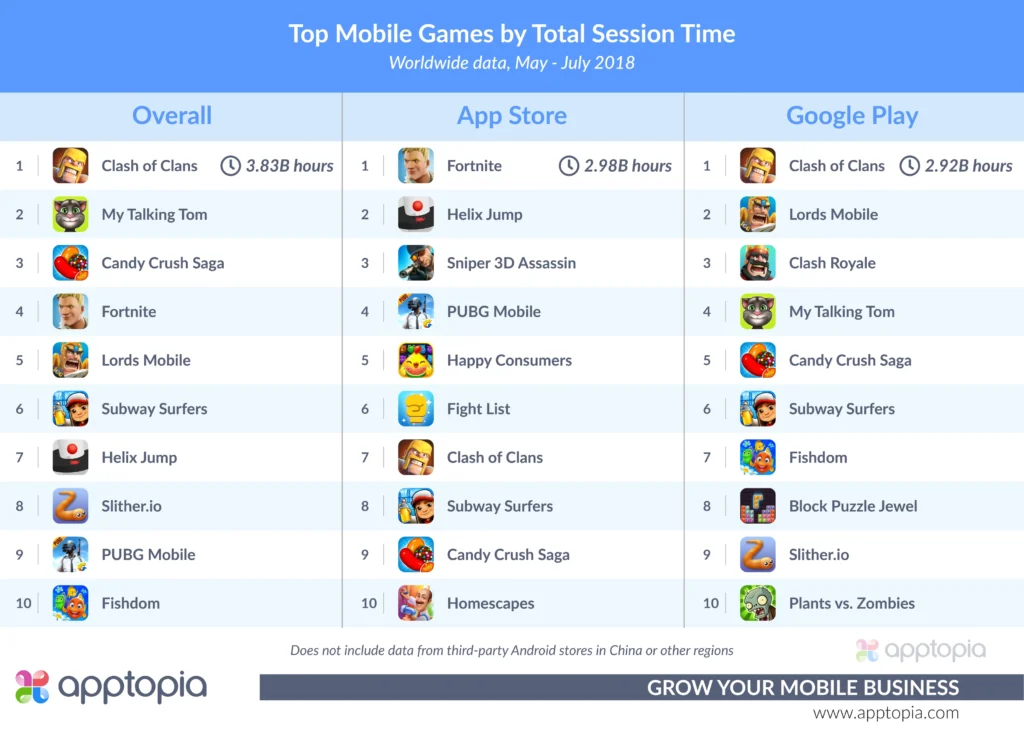
It’s no surprise that more than half of the games in the Overall column are top 50 grossing games in the United States. It’s a lot easier convincing players to spend their money in your app if they already enjoy spending their time there. Even though Fortnite is only available on iOS, it managed to climb into the #4 spot Overall; another feather in the cap of a cap that is… well… full of feathers.
Between the Overall and App Store columns, Voodoo has two mobile apps listed. This proves their heavily downloaded games are also sucking up a bunch of consumer time, leading to what we imagine to be a nice chunk of advertising revenue. *Note – Apptopia is currently developing new advertising revenue models to help publishers understand revenue and app creation in a whole new light.
We’ll be producing more versions of this work across different timeframes to watch user interest change over time. For example, Netflix might be more popular in the winter months. With respect to games, even though there are a few classics lodged in there, I image that chart will fluctuate more than the non-games.
Interested in learning more? Contact us or schedule a demo.

